
Many website owners have a similar experience. WordPress analytics show healthy traffic, pages are getting views, and nothing looks alarming. But something still feels off. You’re not getting the conversions you expected, and you can’t quite put your finger on why.
That’s because analytics can only take you so far. They tell you the results — not the story behind them. They don’t show which sections of your page people pay attention to, where they drop off, or what they completely overlook.
Heatmaps fill in those gaps. With a quick glance, you can see where visitors click, how far they scroll, and how they interact with your pages in real time.
In this guide, I’ll walk you through how to add heatmaps to WordPress and use them to understand your audience — so you can start making changes that actually boost conversions.
In This Article:
- What Are Website Heatmaps? (+ Why WordPress Site Owners Need Them)
- How to Set Up Heatmaps on Your WordPress Site (Step-By-Step)
- 7 Ways to Use Heatmap Data to Boost Conversions
- Common Heatmap Mistakes to Avoid
- Other Heatmap Tools for WordPress
- FAQs About Website Heatmaps for WordPress
What Are Website Heatmaps? (+ Why WordPress Site Owners Need Them)
A website heatmap is a visual tool that shows you how visitors interact with your site. It uses colors to represent activity levels. Typically, red and orange show high activity (hot spots), while blue and green show low activity (cold spots).
Think of it like a weather map. When meteorologists show storms on TV, they use red to show the most intense areas. Heatmaps work the same way for your website.
For more information on the different types of heat maps, check out our beginner’s guide on the benefits of using them.
Why WordPress Site Owners Need Heatmaps
Heatmaps give you an advantage by showing exactly what works and what doesn’t on your site. When you optimize based on what visitors actually do, your conversions go up.
Heatmaps help you:
- Discover what visitors actually click on (versus what you think they click on)
- Find out how far down your pages people scroll before leaving
- Identify confusing elements that frustrate visitors
- Spot opportunities to improve your layout and boost conversions
- Make data-driven decisions instead of guessing
How to Set Up Heatmaps on Your WordPress Site (Step-By-Step)
Ready to see what your visitors are really doing? Now I’m going to show you how to set up heatmaps on WordPress using UserFeedback.
I recommend UserFeedback because it’s built specifically for WordPress, integrates seamlessly without slowing down your site, and gives you powerful filtering options that other tools charge way more for.
Plus, it’s not just a heatmap tool. It’s actually the best survey plugin for WordPress too.
While you’re tracking visitor behavior with heatmaps, you can also ask visitors directly what they think. This combination is powerful. Heatmaps show you what visitors do. Surveys tell you why they do it.
UserFeedback gives you everything you need to run effective surveys:
- Survey essentials: Create unlimited surveys with unlimited questions. Choose from multiple question types—multiple choice, rating scales, open-ended text, and more.
- Ready-to-use templates: Start fast with pre-built templates for NPS, CSAT, and CES surveys. No need to build from scratch.
- Smart targeting: Show different surveys to different visitors based on their behavior, location, device, or traffic source.
- Conditional logic: Create dynamic surveys that change based on how visitors answer. If someone rates you poorly, ask why. If they rate you highly, ask for a testimonial.
- Custom branding: Make surveys match your site’s design. Add your logo, change colors, adjust fonts.
- AI analysis: Let AI analyze open-ended responses and identify patterns. No more reading through hundreds of comments manually.
- Google Analytics integration: All your survey data flows into Google Analytics automatically if you use MonsterInsights.
Get started with UserFeedback today and see what your visitors do and why they do it.
Step 1: Install UserFeedback
First, you need UserFeedback installed on your site. You can start with the free version to test it out, but you’ll need UserFeedback Elite or higher to unlock the full heatmap features.
Go to your WordPress dashboard and navigate to Plugins » Add New. Search for “UserFeedback” and click Install Now, then Activate.

If you want the complete heatmap toolkit (which I highly recommend), upgrade to Elite. You’ll get unlimited heatmap recordings, advanced filtering by traffic source, device-specific insights, and more.
Get UserFeedback Elite here to unlock all heatmap features.
For detailed instructions on installing the premium version of the plugin, see our documentation.
Step 2: Install the Heatmaps Addon
Once you have UserFeedback activated, go to UserFeedback » Addons in your WordPress dashboard.

Find the Heatmaps addon and click Install Addon followed by Activate.
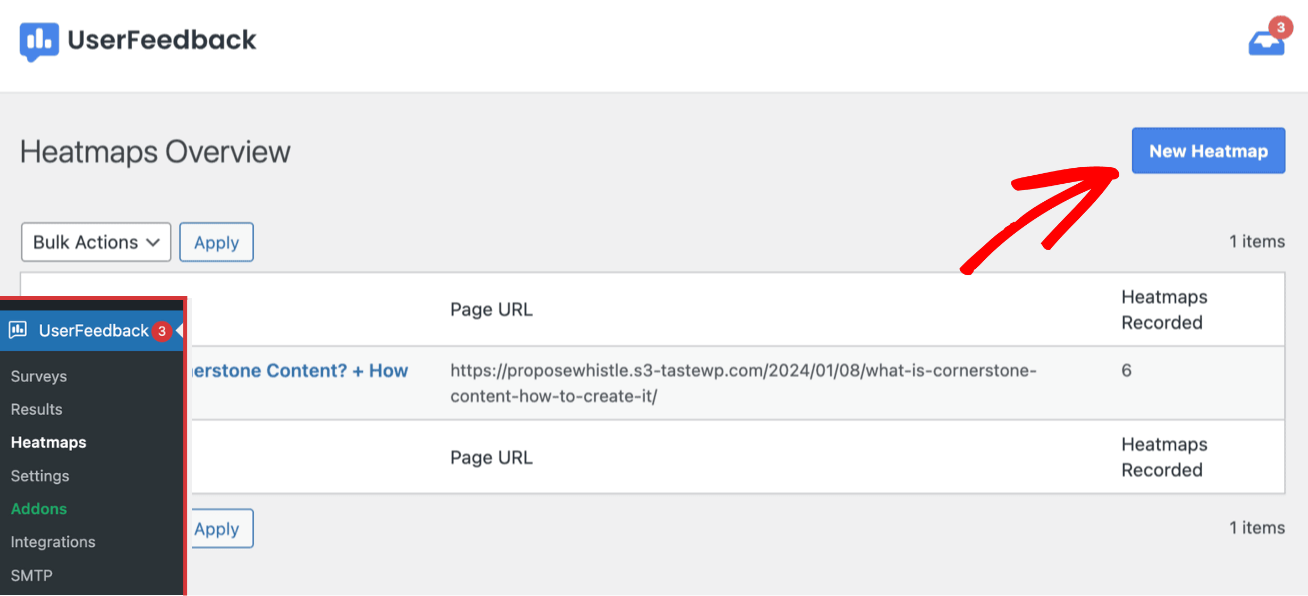
Step 3: Create Your First Heatmap
Navigate to UserFeedback » Heatmaps and click the New Heatmap button.
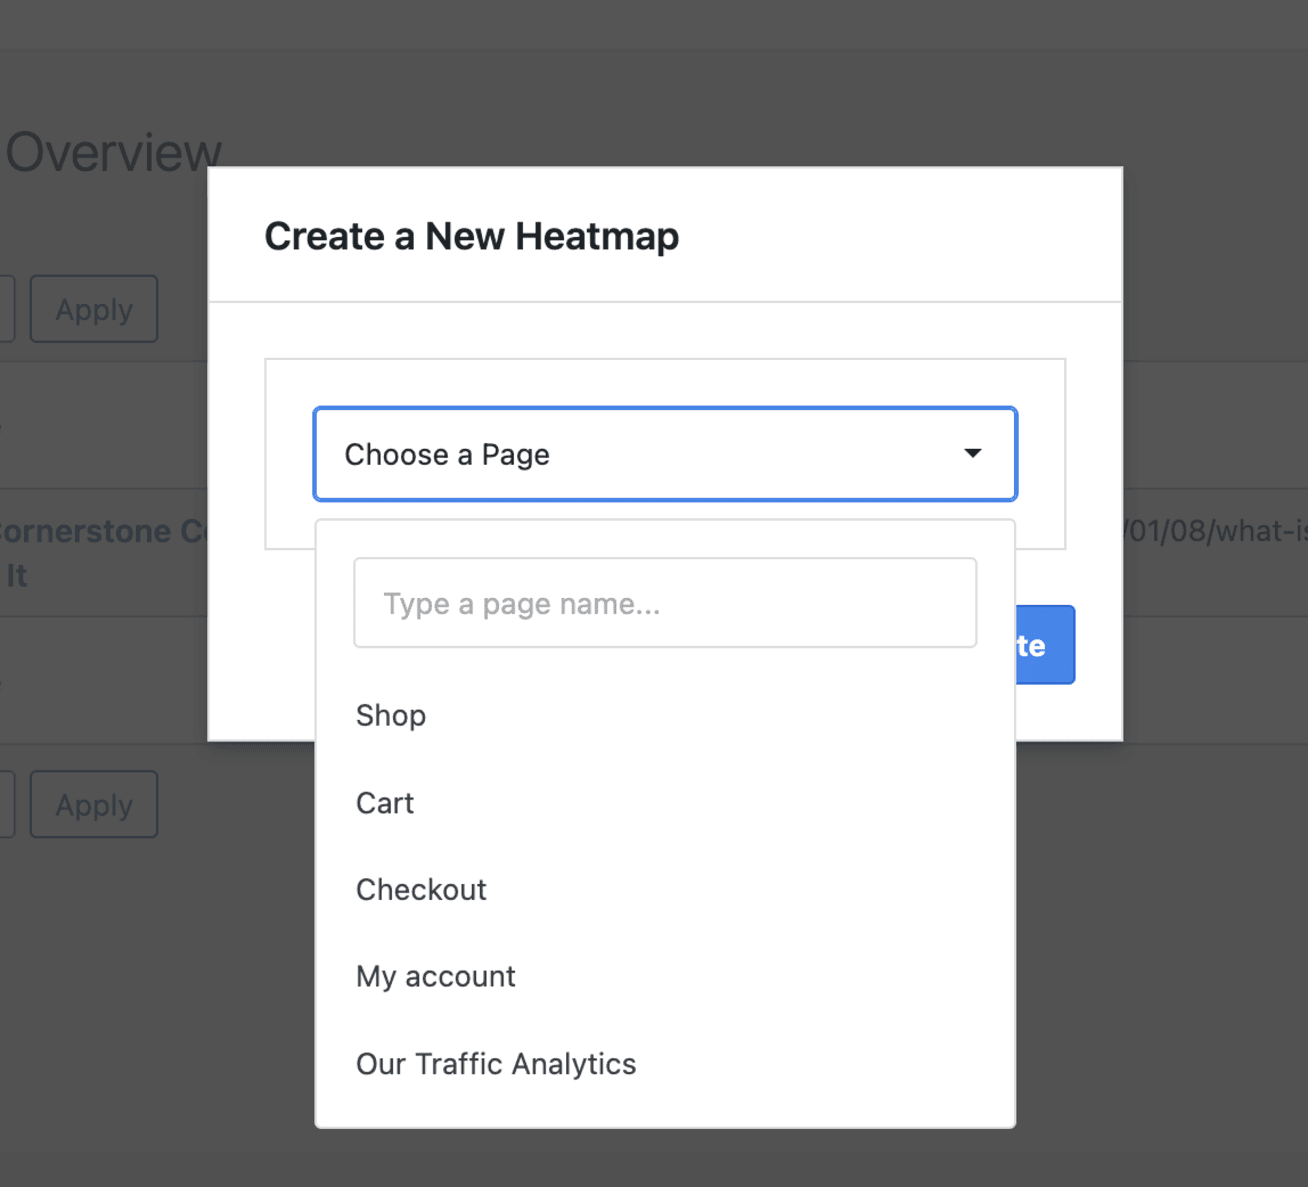
A popup will appear asking you to choose a page. Start with your most important pages—like your homepage, key landing pages, or checkout page.
Select a page from the dropdown menu and click Create.
That’s it! UserFeedback will now track clicks and mouse movements on your chosen page. The plugin runs quietly in the background without affecting your site speed.
Step 4: Let Data Collect (This Is Important!)
Here’s where patience pays off. You need enough visitor data before your heatmap becomes useful.
I recommend waiting until you have at least 100-300 sessions on a page. Higher-traffic pages will hit this number in a few days. Lower-traffic pages might take a week or two.
Don’t rush this step. Making decisions based on too little data is worse than making no decisions at all.
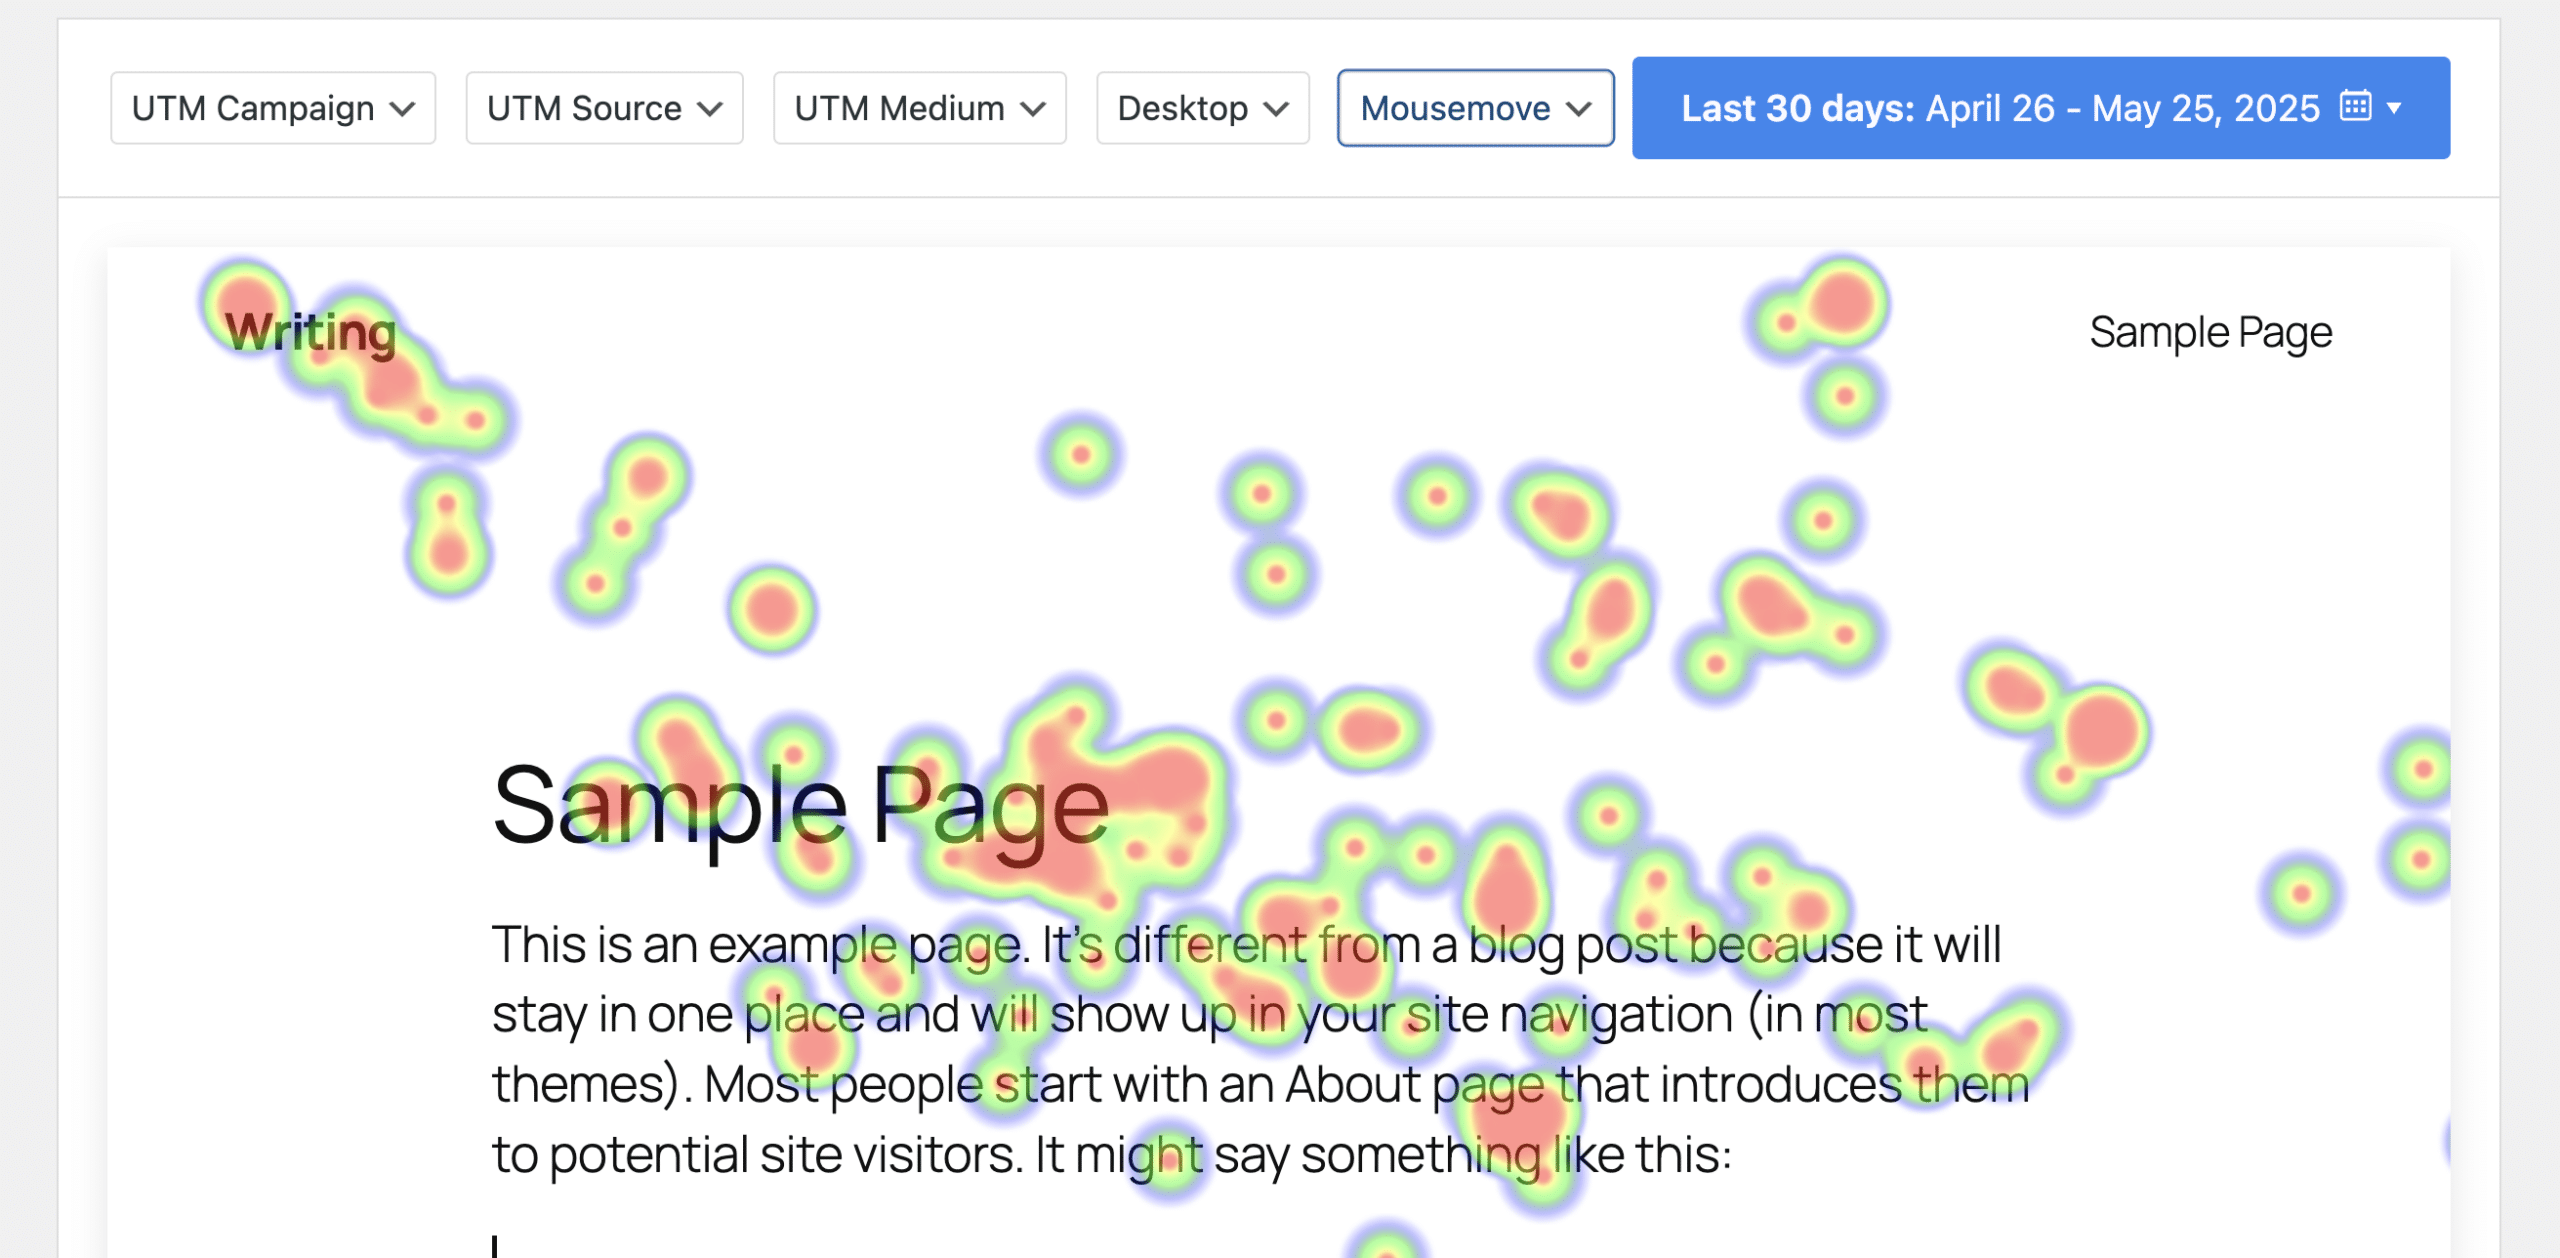
Step 5: View and Filter Your Heatmaps
Once you have enough data, go back to UserFeedback » Heatmaps and click on the page you want to review.
You’ll see your page with a colorful overlay showing visitor activity. Red and orange show hot spots (high activity). Blue shows cold spots (low activity).
Here’s where UserFeedback really shines. Use the filters at the top to segment your data:
- UTM Campaign – See how specific marketing campaigns perform
- UTM Source – Compare traffic from Google vs Facebook vs email
- UTM Medium – Filter by organic, paid, social, etc.
- Device – View separate heatmaps for desktop, tablet, and mobile
- Click or Mousemove – Toggle between click data and mouse movement data
- Date Range – Compare different time periods
These filters are incredibly powerful. You can discover that mobile users behave completely differently from desktop users, or that Facebook traffic clicks different elements than Google traffic.
Step 6: Set Up Automated Cleanup (Optional)
If you want to keep your database clean and your site running fast, set up automated heatmap deletion.
Go to UserFeedback » Settings » Heatmaps and toggle on Enable automated deletion.
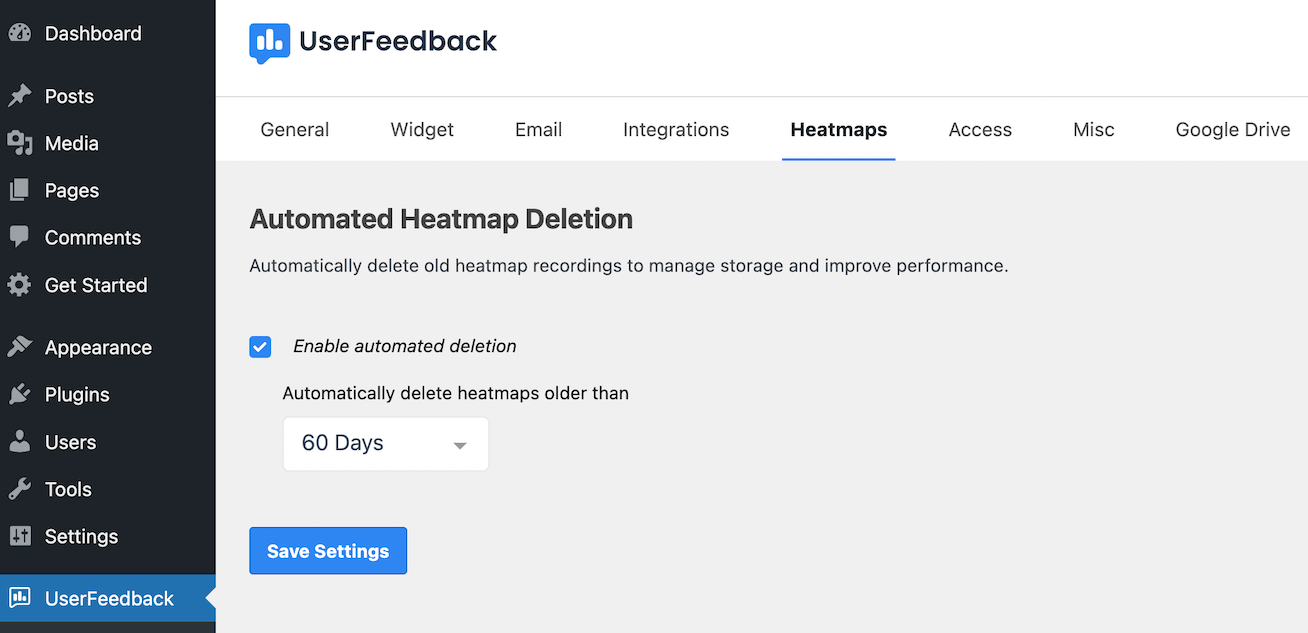
Choose your retention period from the dropdown:
- 1 Year
- 180 Days
- 60 Days
- 30 Days
- 14 Days
- 7 Days
- 1 Day
I usually set this to 60 or 90 days. That gives me enough historical data while keeping things tidy.
Click Save Settings when you’re done.
Pro Tips for Better Heatmap Insights in UserFeedback
- Create separate heatmaps for key pages. Don’t try to track everything at once. Focus on pages that matter most for conversions.
- Always check mobile separately. Your mobile heatmap will look completely different from desktop. Make sure you’re optimizing for both.
- Use UTM parameters in your campaigns. When you run paid ads or email campaigns, add UTM parameters to your links. Then you can filter your heatmaps to see exactly how that traffic behaves.
- Compare before and after. Before you make changes based on heatmap data, note your current conversion rate. After you make changes, compare the results. This helps you measure actual impact.
7 Ways to Use Heatmap Data to Boost Conversions
Getting the heatmap is one thing. Knowing what to do with it is another.
Here are the specific ways you can use heatmap insights to boost conversions on WordPress sites:
1. Fix Broken Expectations
Scan your heatmap for hot spots on non-clickable elements. If visitors are clicking on something repeatedly, they expect it to be clickable.
For instance, you might find that visitors keep clicking on product images in your WooCommerce store, even though only the “Add to Cart” button was clickable.
The fix is simple: turn frequently-clicked non-clickable elements into actual links or buttons.
2. Move Important Elements Above the Fold
Check your heatmap to see where most visitors stop scrolling. If your call-to-action button is below that point, most people never see it.
The “fold” is the bottom of the visible screen before scrolling. On desktop, it’s usually around 600-800 pixels down. On mobile, it’s much higher.
Place your most important elements—especially CTAs—where your scroll heatmap shows the hottest activity.
3. Remove Distracting Elements
Use your WordPress heatmaps to spot elements that steal attention from your main goals.
For instance, you might have an informational sidebar widget that gets tons of attention on a sales page. Although attention is always good, it is better focused on a purchase button or sales-related CTA.
If something competes for attention with your primary call-to-action, remove it or move it somewhere else.
4. Optimize Your Mobile Experience
Create separate heatmaps for mobile and desktop traffic. WordPress sites look different on phones, and visitor behavior changes dramatically on smaller screens.
The average loading time for a WordPress website is 2.5 seconds on desktop and 13.25 seconds on mobile. Slow mobile loading combined with poor mobile UX kills conversions.
Check your mobile heatmaps specifically. Make sure touch targets are large enough and your most important content appears high up on mobile screens.
5. Test Headlines and Copy
If your heatmap shows that visitors barely read your headline or key copy sections, you have a content problem.
Rewrite headlines and copy that show low engagement. Make them shorter, clearer, and more compelling.
6. Improve Your Navigation
Heatmaps can also reveal navigation problems. If you see lots of erratic mouse movement or hovering in your navigation menu, visitors are confused.
Simplify navigation menus that show signs of confusion. Use clearer labels. Reduce the number of options. Make it easier for visitors to find what they need.
7. Optimize Form Placement and Design
Forms are conversion killers when they’re poorly designed. Use click heatmaps to see if visitors are actually interacting with your forms.
If you see abandoned form fields, something’s wrong. Maybe you’re asking for too much information. Maybe the form is too far down the page.
Simplify forms that show low engagement. Remove unnecessary fields. Place forms where your heatmap shows high attention.
Common Heatmap Mistakes to Avoid
Here are some common heatmap mistakes to avoid:
- Don’t make decisions with too little data. Wait until you have at least 100-300 sessions before trusting your heatmap insights. Small sample sizes lead to bad decisions.
- Don’t ignore mobile users. Over half your visitors probably use phones. Always check mobile heatmaps separately from desktop.
- Don’t change everything at once. When you spot problems in your heatmap, resist the urge to fix them all immediately. Change one thing at a time so you know what actually works.
- Don’t forget to test. Heatmaps show you what visitors do, not why they do it. Always A/B test your changes to confirm they actually improve conversions.
Other Heatmap Tools for WordPress
While I recommend UserFeedback, there are other quality heatmap tools that work with WordPress:
- Microsoft Clarity is completely free and offers unlimited heatmaps and session recordings. It’s a great starting point if you’re on a tight budget.
- Hotjar is popular and user-friendly. It offers heatmaps, recordings, and feedback polls. Plans start around $32/month.
- Crazy Egg specializes in visual analytics. It’s easy to set up and offers all major heatmap types. Plans start at $29/month.
- Mouseflow provides advanced features like form analytics and funnel tracking alongside heatmaps. It’s good for larger sites with complex conversion paths.
Each tool has pros and cons. I prefer UserFeedback because it’s built specifically for WordPress and integrates seamlessly with your site without slowing it down.
Get started with UserFeedback today and start creating WordPress heatmaps today!
And that’s it!
I hope you enjoyed this guide to creating heatmaps in WordPress. I’d recommend you also check out:
- Best Net Promoter Score Software Tools to Measure Customer Loyalty
- Bad Survey Questions: Types to Avoid (+ How to Fix Them)
- Website Usability Survey Questions (For Great Feedback)
And remember to follow us on X and Facebook to learn more about online surveys, questions, and customer feedback.
FAQs About Website Heatmaps for WordPress
What is a heatmap on a website?
A heatmap is a visual representation that uses colors to show how visitors interact with your website. Hot colors (red, orange) indicate high activity areas. Cold colors (blue, green) show low activity areas.
Do heatmaps slow down my WordPress site?
Good heatmap tools use asynchronous loading, which means they don’t affect your page load speed. UserFeedback and other quality plugins load in the background without impacting performance.
However, poorly coded heatmap tools can slow down your site. Always test your site speed after installing any new plugin using tools like GTmetrix or Google PageSpeed Insights.
How many visitors do I need for accurate heatmap data?
I recommend at least 100-300 sessions on a page before making optimization decisions based on the heatmap. More is better. Higher-traffic pages can show patterns within days, while lower-traffic pages need more time to collect meaningful data.
Can I use heatmaps on my WooCommerce store?
Absolutely! Heatmaps are especially valuable for eCommerce sites. Use them to optimize product pages, cart pages, and checkout flows. Small improvements in these areas can dramatically increase revenue.
Are heatmaps better than Google Analytics?
They’re not better—they’re different. Google Analytics tells you what happened (how many visitors, bounce rate, conversions). Heatmaps show you how it happened (where visitors clicked, scrolled, and paid attention).
Use them together for complete insights. Google Analytics identifies problem pages. Heatmaps help you fix those pages.
Do I need coding skills to set up heatmaps on WordPress?
No! Modern heatmap plugins like UserFeedback install with just a few clicks. You don’t need to touch any code. The plugin handles all the technical setup automatically.
Can I see individual visitor sessions or just aggregated data?
Most heatmap tools show aggregated data from all visitors. However, many also offer session recording features that let you watch individual visitor sessions. This combination is powerful—heatmaps show patterns, and recordings help you understand the “why” behind those patterns.