
You send out a survey to your customers, but the responses don’t tell you much about who’s actually answering. The feedback feels generic, and you’re left wondering if these insights represent your real audience or just a small slice of it.
That’s exactly why I always include demographic survey questions in my research. These questions transform raw survey data into actionable insights by revealing the people behind the responses.
In my experience helping businesses understand their customers, demographic questions are the foundation of meaningful market research.
I’ll show you exactly how to craft demographic questions that people actually want to answer, plus give you 15+ proven examples you can use right away. By the end of this guide, you’ll know how to collect demographic data that drives real business decisions.
Table of Contents
- What Are Demographic Survey Questions?
- Why Demographic Questions Matter
- 15+ Essential Demographic Questions with Examples
- Best Practices for Asking Demographic Questions
- Where to Place Demographic Questions in Your Survey
- How to Use Demographic Data
- FAQs
What Are Demographic Survey Questions?
Demographic survey questions collect information about your respondents’ personal characteristics and background. They help you understand who your customers are, not just what they think.
These questions typically cover:
- Age and gender
- Location and education level
- Income and employment status
- Family situation and lifestyle
Think of demographic questions as the foundation of your survey. They give context to every other answer you receive.
Pro Tip: The global market research industry reached $140 billion in 2024, with demographic segmentation driving much of this growth. Companies that use demographic data effectively see significantly better marketing results.
Why Demographic Questions Matter
I’ve seen businesses waste thousands of dollars on marketing campaigns that missed their target audience. Demographic data prevents this costly mistake.
Here’s why demographic questions are crucial:
Create Accurate Buyer Personas
Demographic data helps you build detailed profiles of your ideal customers. Instead of guessing who buys from you, you’ll know their age, income, location, and lifestyle.
Read our guide on How to Create a Buyer Persona in 5 Easy Steps.
Identify Trends and Patterns
When you segment survey responses by demographics, patterns emerge. You might discover that Gen Z customers prefer different communication channels than Baby Boomers, or that high-income respondents have different pain points.
Validate Your Target Audience
76% of organizations say demographic surveys are crucial for informed decision-making. These questions help confirm you’re reaching the right people with your research.
Improve Marketing ROI
Demographic insights let you craft messages that resonate with specific groups. This targeted approach typically delivers much better results than generic marketing.
15+ Essential Demographic Questions with Examples

Here are the most important demographic questions to include in your surveys, with examples of how to ask them effectively:
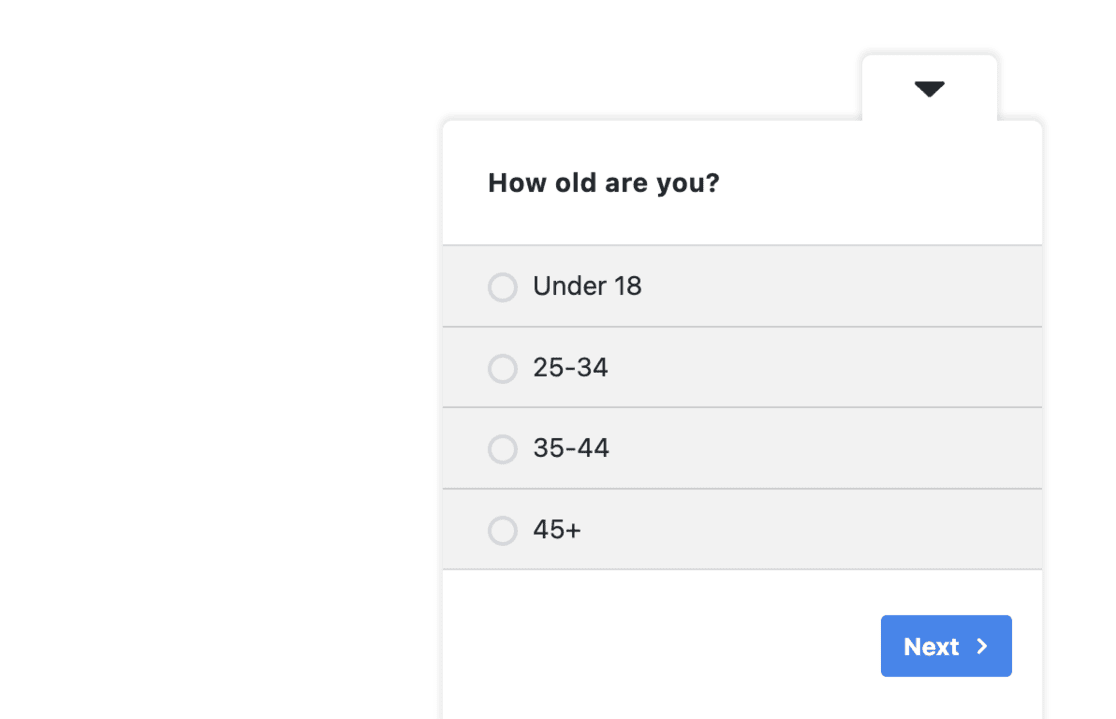
1. Age
Age reveals generational differences in preferences, behaviors, and values.
Example Question: “What is your age?”
- Under 18
- 18-24
- 25-34
- 35-44
- 45-54
- 55-64
- 65+
Pro Tip: Use age ranges instead of asking for exact ages. This feels less invasive and makes data analysis easier.
If you’re running a WordPress site, UserFeedback easily allows you to create these types of questions by using the radio button question type:
2. Gender
Gender questions help you understand diverse perspectives within your audience.
Example Question: “What is your gender?”
- Female
- Male
- Non-binary
- Prefer to self-describe: _______
- Prefer not to say
3. Location
Geographic data reveals regional trends and helps with targeting.
Example Question: “What is your current location?”
- United States
- Canada
- United Kingdom
- Australia
- Other: _______
For local businesses, ask for city or zip code instead.
4. Education Level
Education level indicates knowledge base and potentially earning power.
Example Question: “What is your highest level of education?”
- High school or less
- Some college
- Bachelor’s degree
- Master’s degree
- Doctorate or professional degree
- Trade or vocational school
5. Annual Household Income
Income data helps you understand purchasing power and price sensitivity.
Example Question: “What is your annual household income?”
- Under $25,000
- $25,000-$49,999
- $50,000-$74,999
- $75,000-$99,999
- $100,000-$149,999
- $150,000+
- Prefer not to say
6. Employment Status
Employment status reveals lifestyle, schedule, and financial stability.
Example Question: “What is your current employment status?”
- Employed full-time
- Employed part-time
- Self-employed
- Retired
- Student
- Unemployed
- Unable to work
7. Marital Status
Marital status affects purchasing decisions and lifestyle choices.
Example Question: “What is your marital status?”
- Single
- Married
- Divorced
- Widowed
- In a relationship
- Prefer not to say
8. Family and Dependents
Family size influences needs, priorities, and spending patterns.
Example Question: “How many children under 18 live in your household?”
- None
- 1
- 2
- 3
- 4 or more
9. Ethnicity
Ethnicity provides cultural context and helps ensure diverse representation.
Example Question: “How would you describe your ethnicity? (Select all that apply)”
- White/Caucasian
- Black/African American
- Hispanic/Latino
- Asian
- Native American
- Pacific Islander
- Middle Eastern
- Other: _______
- Prefer not to say
10. Language
Language data helps with communication preferences and cultural understanding.
Example Question: “What language do you primarily speak at home?”
- English
- Spanish
- French
- Chinese
- Other: _______
11. Industry (for B2B surveys)
Industry information helps segment business audiences.
Example Question: “What industry do you work in?”
- Technology
- Healthcare
- Finance
- Education
- Manufacturing
- Retail
- Other: _______
12. Company Size (for B2B surveys)
Company size affects purchasing processes and needs.
Example Question: “How many employees does your company have?”
- 1-10
- 11-50
- 51-200
- 201-500
- 500+
13. Job Title/Role
Job titles reveal decision-making authority and responsibilities.
Example Question: “What is your job title?” [Open text field]
14. Housing Situation
Housing status indicates stability and lifestyle.
Example Question: “What is your current housing situation?”
- Own my home
- Rent my home
- Live with family
- Other: _______
15. Political Views (use carefully)
Political affiliation can reveal values and priorities, but use sparingly.
Example Question: “How would you describe your political views?”
- Very liberal
- Liberal
- Moderate
- Conservative
- Very conservative
- Prefer not to say
Best Practices for Asking Demographic Questions
I’ve learned these best practices through years of creating surveys that people actually complete:
Make Questions Optional When Possible
75% of consumers believe data privacy is a basic human right. Always include “Prefer not to say” options for sensitive questions.
Also, check out our full guide to How to Make a GDPR-Compliant Survey (7 Best Practices).
Use Inclusive Language
Avoid assumptions and provide options for diverse identities. Include write-in fields for questions like gender and ethnicity.
Keep It Simple
Use clear, straightforward language. Avoid jargon or complex terms that might confuse respondents.
Limit the Number of Questions
Don’t ask for demographic information you won’t use. Surveys with 1-3 questions have an 83% completion rate, while longer surveys see much lower completion rates.
Test Your Questions
Different audiences may interpret questions differently. Test your demographic questions with a small group first.
Be Transparent About Usage
Explain why you’re asking for demographic information and how you’ll use it. This builds trust and increases response rates.
For more, read our guide on How to Make a Good Survey: 13 Practical Tips.
Where to Place Demographic Questions in Your Survey
The placement of demographic questions can significantly impact completion rates. Here’s what works best:
End of Survey (Recommended)
Place demographic questions at the end of your survey. This approach:
- Lets respondents focus on your main questions first
- Reduces drop-off from personal questions
- Ensures you get core data even if people don’t complete demographics
Beginning of Survey (Use Sparingly)
Only place demographic questions at the beginning if you need them for:
- Screening qualified respondents
- Routing people to different question sets
- Qualifying for incentives
Mixed Approach
For longer surveys, you might mix demographic questions throughout, but this can feel intrusive.
Pro Tip: Online surveys achieve an average 44% response rate, but demographic questions can reduce this if placed poorly.
How to Use Demographic Data
Once you collect demographic data, here’s how to put it to work:
Segment Your Audience
The real power of demographic data comes from grouping responses to spot patterns you’d never see otherwise.
Start with basic cross-tabulations. Look at how different age groups answered your main survey questions. You might discover that:
- Customers under 35 rate mobile experience as “extremely important” (78%) vs. customers over 55 (45%)
- High-income respondents ($100K+) prioritize quality over price (89% vs. 34% for under $50K)
- Urban customers have different pain points than rural customers
Use demographic filters to dive deeper. Let’s say you’re analyzing customer satisfaction scores. Instead of looking at the overall average, filter by:
- Age + Income: Young, high-income customers might have different expectations
- Location + Education: College-educated customers in major cities might need different messaging
- Employment + Family status: Working parents have unique time constraints and priorities
I always create demographic segments that combine 2-3 characteristics. These detailed profiles reveal insights you’d miss with single-variable analysis.
Create Targeted Marketing
Demographic insights let you craft messages that actually resonate instead of generic campaigns that please no one.
Develop demographic-specific campaigns. Here’s how I approach this:
For younger audiences (18-34):
- Use mobile-first design
- Include social proof and user-generated content
- Focus on convenience and speed
- Highlight sustainability and social impact
For older audiences (55+):
- Emphasize trust and reliability
- Use larger fonts and simpler navigation
- Include phone support options
- Focus on value and long-term benefits
Income-based messaging:
- Higher income: Emphasize premium features, exclusivity, and time-saving benefits
- Lower income: Highlight value, savings, and practical benefits
Geographic targeting:
- Urban customers: Focus on convenience, delivery, and time-saving
- Rural customers: Emphasize reliability, durability, and local support
Pro Tip: Personalized marketing campaigns see 20% higher conversion rates because they speak directly to what matters most to each segment.
Identify New Opportunities
Demographic data often reveals opportunities hiding in plain sight.
Look for underserved segments. I once worked with a fitness app that discovered their surveys showed strong interest from customers over 50, but their marketing only targeted younger users. This insight led to a successful “50+ fitness” campaign that opened an entirely new market.
Find geographic expansion opportunities. If you see strong engagement from unexpected regions, consider expanding your service area or adjusting your messaging for those markets.
Discover product gaps. When you segment satisfaction scores by demographics, you might find that certain groups consistently rate specific features as “needs improvement.” This points to product development opportunities.
Spot emerging trends early. Demographic data can reveal shifting preferences before they become mainstream. For example, if younger customers increasingly mention environmental concerns, you can adjust your positioning ahead of competitors.
Validate Business Decisions
Use demographic insights to support strategic decisions with data instead of gut feelings.
Product development decisions:
- “Our survey shows 73% of customers aged 25-40 would pay 15% more for eco-friendly packaging.”
- “High-income customers (78%) want premium support options, while budget-conscious customers (34%) prefer self-service.”
Pricing strategy validation:
- Analyze price sensitivity by income level
- Look at the willingness to pay by age group
- Check geographic differences in price expectations
Market expansion decisions:
- Identify which demographics show the strongest interest in new products
- Validate demand in specific geographic markets
- Confirm that your target demographic actually exists in new markets
Marketing budget allocation:
- Spend more on channels that reach your highest-value demographics
- Adjust messaging based on what resonates with your core audience
- Test new channels based on demographic preferences
Improve Customer Experience
Demographics reveal how different groups prefer to interact with your business.
Customize support channels:
- Gen Z and Millennials: Prefer chat, social media, and self-service options
- Gen X: Value email support and comprehensive FAQs
- Boomers: Still prefer phone support and personal interaction
Tailor communication style:
- Younger customers: Casual, emoji-friendly, brief messages
- Older customers: Professional, detailed, formal communication
- High-income customers: Concise, premium positioning
- Budget-conscious customers: Value-focused, detailed explanations
Optimize user experience:
- Mobile-first design for younger demographics
- Simplified navigation for older users
- Multiple payment options based on regional preferences
- Accessibility features for customers with disabilities
Personalize product recommendations:
- Use demographic data to suggest relevant products
- Adjust default settings based on user profiles
- Create demographic-specific onboarding flows
The key is connecting demographic insights to actionable changes. Every demographic pattern you discover should lead to a specific improvement in how you serve that segment.
Check out How to Perform Customer Feedback Analysis (Step-by-step).
The Best Tool for Creating Demographic Surveys
Now that you understand how to create effective demographic survey questions, let me introduce you to the easiest way to implement them: UserFeedback.

UserFeedback is the best survey plugin for WordPress users who want to collect demographic data without any technical hassle. I’ve used dozens of survey tools over the years, and UserFeedback consistently delivers the best results for demographic research.
Why UserFeedback is Perfect for Demographic Surveys
Pre-built demographic templates: UserFeedback includes ready-to-use demographic question templates that follow best practices. You don’t need to write questions from scratch—just customize the included examples.
Conditional logic: Show different demographic questions based on previous answers. For example, only ask about company size if someone indicates they work for a business.
Multiple question types: UserFeedback supports all the question formats you need for demographic surveys:
- Multiple choice for age ranges and education levels
- Checkboxes for ethnicity (select all that apply)
- Dropdown menus for location and industry
- Text fields for open-ended responses
Smart targeting: Display your demographic surveys to specific audiences based on pages visited, traffic source, or user behavior.
Professional reporting: Get instant insights with automatic demographic data analysis and beautiful reports that make patterns easy to spot.
Key Features for Demographic Research
Unlimited surveys and responses: Collect as much demographic data as you need without worrying about limits.
Mobile-optimized: Since 51.5% of survey responses come from mobile devices, UserFeedback ensures your demographic questions look great on phones and tablets.
Privacy-friendly: Built-in privacy controls help you comply with data protection regulations while collecting demographic information.
Integration with Google Analytics: Connect demographic data with your website analytics for deeper insights through MonsterInsights.
Easy setup: Install and launch your first demographic survey in minutes, not hours.
Whether you’re conducting market research, improving customer experience, or building buyer personas, UserFeedback makes demographic data collection simple and effective.
Get started with UserFeedback today and transform how you understand your audience!
And that’s it!
I hope you liked this demographic survey question guide. Be sure to also check out:
- Guide: Survey Reminder Emails That Get Responses (+Examples)
- The Ultimate Guide to Customer Feedback
- 44 Customer Survey Questions + Guide to Meaningful Feedback
- 10 Online Survey Examples to Get You Started
And remember to follow us on X and Facebook to learn more about online surveys, questions, and customer feedback.
FAQs
What are demographic survey questions?
Demographic survey questions collect information about respondents’ personal characteristics, like age, gender, income, education, and location. They help you understand who your audience is and segment responses for better insights.
Why are demographic questions important in surveys?
Demographic questions provide context for survey responses, help create accurate buyer personas, identify trends within specific groups, and enable targeted marketing strategies. They’re essential for making data-driven business decisions.
Where should I place demographic questions in my survey?
Place demographic questions at the end of your survey in most cases. This ensures respondents complete your main questions first and reduces drop-off from personal questions. Only place them at the beginning if you need them for screening or routing.
How many demographic questions should I include?
Include only the demographic questions you’ll actually use for analysis. Generally, 5-8 demographic questions are sufficient for most surveys. More questions can lead to survey fatigue and lower completion rates.
Should demographic questions be mandatory?
Make demographic questions optional whenever possible. Always include “Prefer not to say” options for sensitive topics like income, politics, or religion. This respects privacy and increases completion rates.