
Too many customer service teams are flying blind. They know something’s wrong when customers start leaving, but by then it’s too late.
The problem isn’t that you lack data. Your helpdesk software likely tracks dozens of numbers. The problem is figuring out which ones actually predict customer churn, and which ones just look good in a quarterly report.
The companies that retain customers don’t track everything. They track the right things—metrics that reveal problems before they become expensive.
In this guide, I’ll show you which customer service performance metrics to track and how to use them to build a support team that keeps customers happy and loyal.
Let’s dive in!
In This Article:
- Why Customer Service Metrics Matter More Than Ever
- What Are Customer Service Metrics?
- The Two Types of Metrics You Need to Know
- 12 Key Performance Metrics for Customer Service Teams
- Track These Metrics Automatically with UserFeedback
- How to Choose the Right Metrics for Your Business
- Frequently Asked Questions: Customer Service Metrics
Why Customer Service Metrics Matter More Than Ever
Customer expectations have hit an all-time high in recent years. And the numbers prove it.
Research shows that after one negative experience, consumers reduce or stop spending with a brand more than half the time (51%). That’s just one bad experience—not three or five.
The cost of getting this wrong? Massive.
Bad customer experiences put $3.7 trillion in sales at risk globally. That’s a 19% increase from 2023, according to research from the Qualtrics XM Institute.
But here’s the good news: companies that track the right customer service performance metrics and use them to improve dramatically outperform competitors.
When you know what’s working and what’s broken, you can fix problems before they cost you customers.
Customer service metrics give you three critical advantages:
- You spot problems before customers leave. Dipping satisfaction scores warn you that something’s wrong.
- You prove your team’s value. Hard numbers show leadership that support drives revenue, not just costs.
- You make smart decisions about where to improve. Instead of guessing, you know exactly what needs fixing.
With the right metrics in place, you transform customer service from a cost center into a growth driver.
What Are Customer Service Metrics?
Let me break this down simply.
Customer service metrics are measurements that show how well your support team performs. They track everything from how fast you respond to how happy customers feel after you help them.
These metrics (also called key performance indicators or KPIs) give you a scorecard for your customer service. Just like a sports team tracks wins and losses, you need to track the numbers that show if you’re winning with customers.
Every metric tells you something different. Some show operational efficiency (how fast your team works). Others show customer sentiment (how customers feel about your service).
The best customer service teams track both. Speed matters, but only if customers walk away satisfied.
The Two Types of Metrics You Need to Know
Not all customer service performance metrics measure the same things. It’s best to group them into two categories.
Quantitative Metrics (Operational Data)
These are hard numbers about your team’s work. They answer questions like:
- How many tickets did we handle?
- How long did customers wait for a response?
- How quickly did we solve problems?
Examples include:
- First Response Time
- Average Resolution Time
- Ticket Volume
- First Contact Resolution Rate
These metrics show you how efficiently your team operates. They’re great for finding bottlenecks and improving workflows.
Qualitative Metrics (Experience Data)
These measure how customers feel about your service. They answer questions like:
- Are customers happy with the help they received?
- Would they recommend us to friends?
- Was it easy or frustrating to get help?
Examples include:
- Customer Satisfaction Score (CSAT)
- Net Promoter Score (NPS)
- Customer Effort Score (CES)
These metrics reveal the emotional side of customer service. A team can be fast but still leave customers frustrated.
You need both types. Speed without satisfaction leads to rushed, poor service. High satisfaction with slow response times still frustrates customers.
The best support teams balance both.
12 Key Performance Metrics for Customer Service Teams
Let’s get into the metrics that actually matter. I’ll explain what each one measures, how to calculate it, and what score you should aim for.
1. Customer Satisfaction Score (CSAT)
CSAT measures how happy customers are with your service right after an interaction.
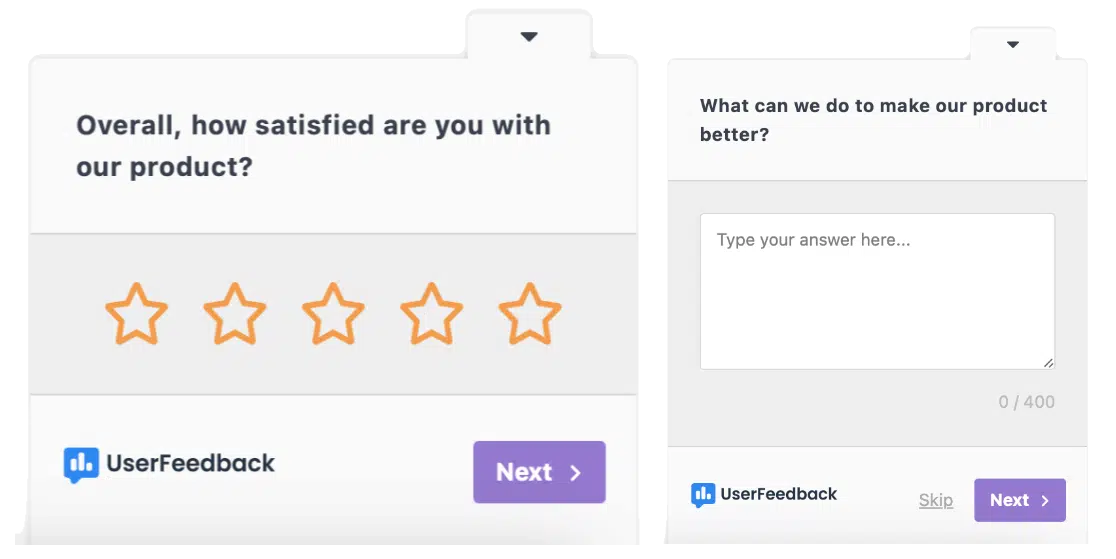
It’s the most direct way to gauge satisfaction. You send a quick survey asking: “How satisfied were you with your recent service experience?”
Customers rate their experience on a scale (usually 1-5 or 1-10). The higher the average score, the better you’re doing.
How to Calculate CSAT:
CSAT = (Number of satisfied responses / Total responses) × 100
Count responses of 4 or 5 (on a 5-point scale) as satisfied. Then divide by total responses and multiply by 100 to get your percentage.
Example: If 80 customers rate you 4 or 5, and 100 total customers respond, your CSAT is 80%.
What’s a Good Score?
According to industry benchmarks, CSAT scores between 76-78% are average, while scores above 80% are considered good. Top-performing companies achieve 85% or higher.
Pro Tip: Send CSAT surveys immediately after closing a ticket. Customers remember the experience better and give more accurate feedback.
With UserFeedback, you don’t have to calculate CSAT manually. Our WordPress plugin can automatically send CSAT surveys after each support interaction and calculate your score in real-time. You can see your satisfaction trends right from your dashboard.
Check out our beginner’s guide on how to improve your CSAT score to learn more.
2. Net Promoter Score (NPS)
NPS measures customer loyalty by asking one simple question: “How likely are you to recommend our company to a friend or colleague?”
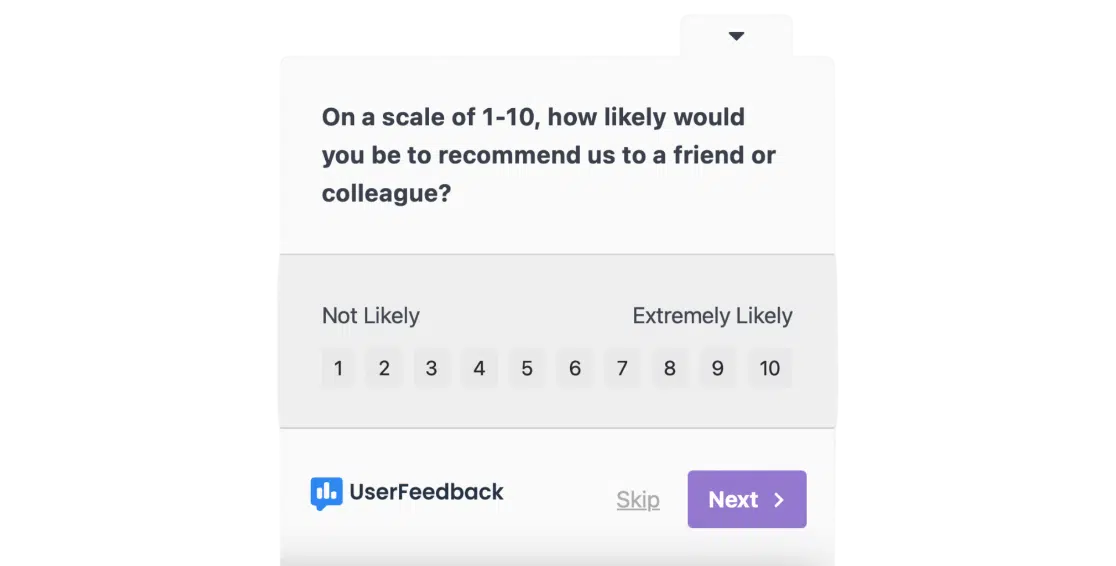
Customers rate their likelihood on a scale of 0-10. Based on their answer, they fall into three groups:
- Promoters (9-10): Loyal fans who will refer others
- Passives (7-8): Satisfied but not enthusiastic
- Detractors (0-6): Unhappy customers who might hurt your reputation
How to Calculate NPS:
NPS = % of Promoters − % of Detractors
First, calculate what percentage of respondents are Promoters and what percentage are Detractors. Then subtract the Detractor percentage from the Promoter percentage.
Example: If 60% are Promoters and 20% are Detractors, your NPS is 40.
What’s a Good Score?
The average NPS in retail is 41. Anything above 50 is excellent.
Pro Tip: Always follow up your NPS question with “Why did you give that score?” The reasons behind the number give you actionable insights.
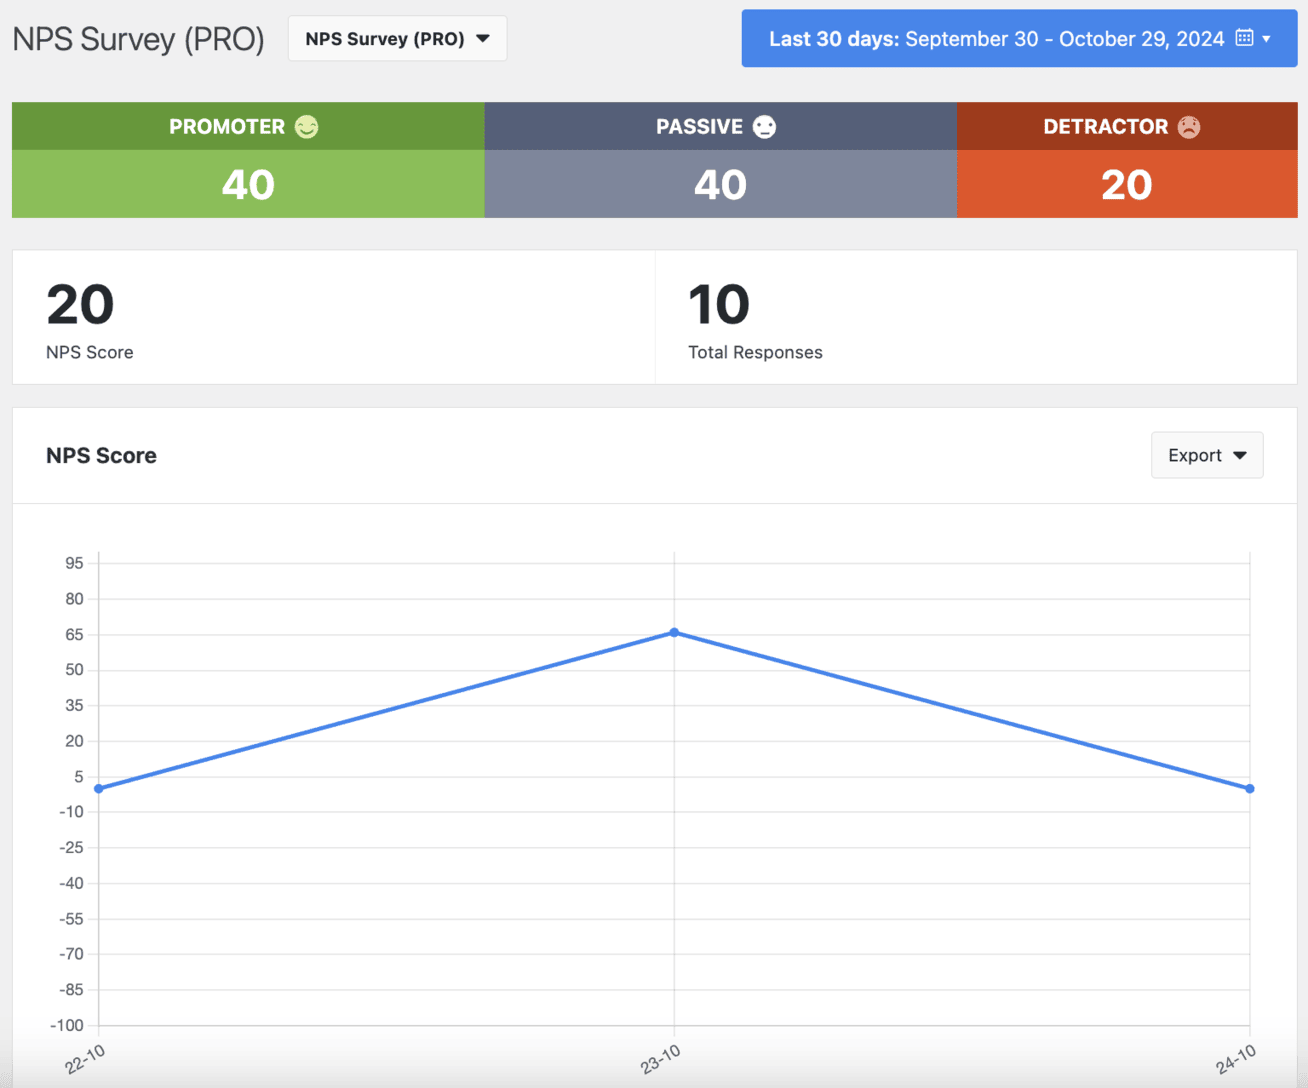
UserFeedback makes NPS surveys simple. Our built-in NPS template automatically categorizes respondents into Promoters, Passives, and Detractors, and calculates your score for you.
3. Customer Effort Score (CES)
CES measures how easy or difficult it was for a customer to get help or complete a task.
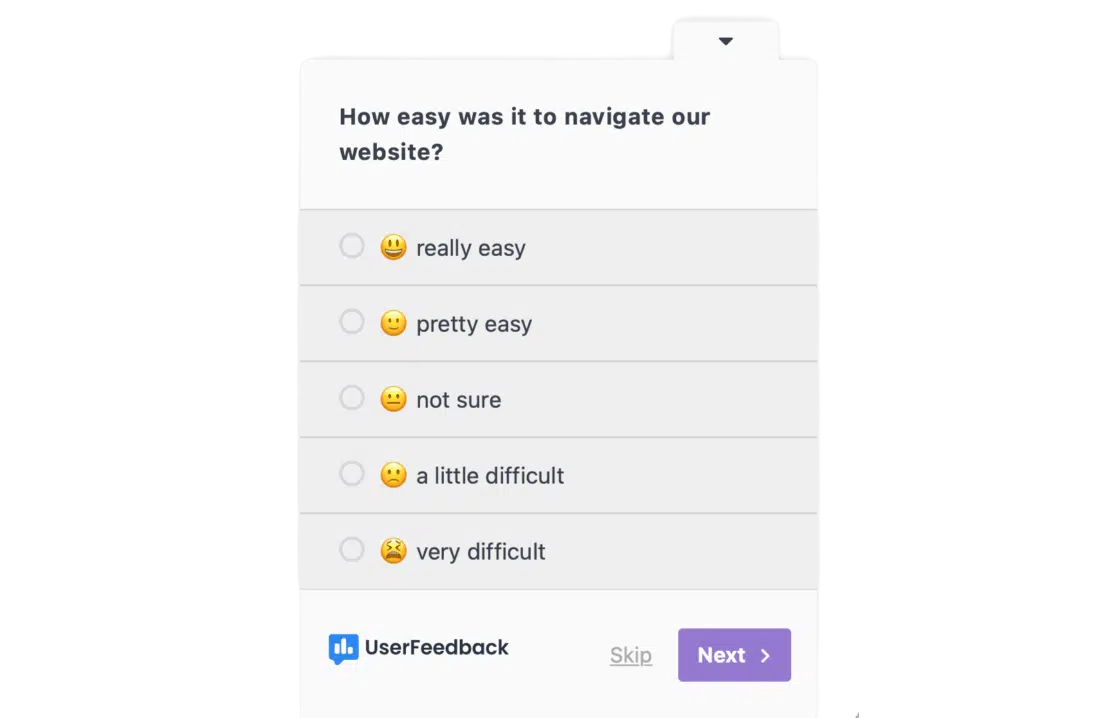
A frustrating experience drives people away faster than an average one keeps them loyal.
The survey typically asks: “How easy was it to resolve your issue?” Customers respond on a scale from “Very Difficult” to “Very Easy.”
How to Calculate CES:
CES is the average of all responses. Add up all scores and divide by the number of responses.
Example: If 100 customers respond with an average rating of 5.5 on a 7-point scale, your CES is 5.5.
What’s a Good Score?
Higher is better. On a 7-point scale, aim for 5.5 or above.
Pro Tip: Send CES surveys right after support interactions. Customers remember how hard they worked to get help.
See our guide on how to get your CES score for more information.
4. First Response Time (FRT)
First Response Time tracks how long customers wait before getting their first human response.
This doesn’t include auto-replies. It’s the time from when a customer contacts you until an agent personally responds.
Speed matters here. Even if you can’t solve the problem immediately, a quick acknowledgment eases anxiety and shows you care.
How to Calculate FRT:
FRT = Total time to send first responses / Total number of tickets
Add up all the time it took to send first responses, then divide by the number of tickets handled.
What’s a Good Time?
For live chat: 50-60 seconds is average
For email: Under 1 hour is ideal
For phone: Immediate (no wait time or short hold)
Pro Tip: Set different FRT targets for different channels. Customers expect instant responses on chat but tolerate longer waits for email.
5. First Contact Resolution (FCR)
First Contact Resolution measures how often you solve a customer’s problem on the first try, without them needing to follow up.
This metric matters because customers hate repeating themselves. Nothing frustrates people more than explaining the same issue to three different agents.
When you solve problems quickly and completely, satisfaction soars.
How to Calculate FCR:
FCR = (Issues resolved on first contact / Total eligible issues) × 100
Not every issue qualifies for FCR. Complex problems requiring escalation or product fixes don’t count. Focus on issues your team should be able to resolve immediately.
Example: If agents resolve 70 issues out of 100 eligible cases on first contact, your FCR is 70%.
What’s a Good Rate?
70% is average. 70-79% is good. 80% or higher is world-class.
Companies with an FCR rate above 78% report significantly higher customer satisfaction and retention.
Pro Tip: Track FCR by channel. Email might have a higher FCR than phone because agents have more time to research answers.
6. Average Resolution Time
Average Resolution Time tracks how long it takes to fully resolve a customer’s issue from start to finish.
This includes all back-and-forth communication, research time, and any follow-ups. It ends only when the ticket closes, and the problem is solved.
While customers appreciate fast responses, what they really want is fast resolution. Nobody wants to wait days for a simple fix.
How to Calculate Average Resolution Time:
Average Resolution Time = Total resolution time / Number of resolved tickets
Add up the time it took to resolve all tickets, then divide by how many tickets you closed.
What’s a Good Time?
This varies wildly by industry and issue complexity. Simple password resets should take minutes. Technical troubleshooting might take hours or days.
The key is to track your own baseline and improve from there. Set targets based on issue type rather than a single blanket goal.
Pro Tip: Pair this metric with CSAT. If resolution time is low but satisfaction drops, your team might be rushing through tickets without actually helping.
7. Ticket Volume
Ticket Volume simply counts how many support requests you receive over a specific period (daily, weekly, or monthly).
This metric reveals workload trends and can flag bigger problems. A sudden spike often indicates product bugs, unclear documentation, or broken features.
Steady growth in ticket volume while your customer base stays flat is a red flag. It means more people need help more often.
How to Track It:
Count total tickets received during your chosen timeframe. Break it down by:
- Channel (email, chat, phone, social media)
- Issue type (billing, technical, how-to questions)
- Time period (daily, weekly, monthly)
What to Watch For:
Look for patterns. If ticket volume doubles after a product release, your update probably confused users. If billing tickets spike on the 1st of each month, customers need clearer invoices.
Declining ticket volume despite growing customers? That’s great news. It likely means your self-service resources (help docs, FAQs) are working.
8. Customer Retention Rate
Customer Retention Rate measures what percentage of customers stick with you over time.
Keeping existing customers costs much less than acquiring new ones. That makes retention one of the most important business metrics you can track.
Great customer service directly drives retention. 93% of customers are likely to make repeat purchases with companies that offer excellent customer service.
How to Calculate Retention Rate:
Retention Rate = [(Customers at end of period − New customers) / Customers at start of period] × 100
Example: You start the quarter with 500 customers. You end with 480 customers after gaining 50 new ones and losing 70 existing ones.
Retention Rate = [(480 − 50) / 500] × 100 = 86%
What’s a Good Rate?
This varies by industry. SaaS companies often aim for 90%+ annual retention. eCommerce might target 60-70% due to one-time purchases.
The key is tracking changes over time. If retention drops, investigate why customers are leaving.
Pro Tip: Survey customers who cancel to understand what drove them away. Their feedback points directly to what needs fixing.
9. Customer Churn Rate
Customer Churn Rate is the flip side of retention. It measures the percentage of customers who stop doing business with you.
Every business loses some customers. The question is: are you losing them faster than you’re gaining new ones?
Poor customer service is often the final straw.
How to Calculate Churn Rate:
Churn Rate = (Customers lost during period / Customers at start of period) × 100
Example: You start the month with 1,000 customers and lose 50 by the end.
Churn Rate = (50 / 1,000) × 100 = 5%
What’s a Good Rate?
Lower is always better. The average churn rate in eCommerce is 25.4%. SaaS companies typically aim for monthly churn under 5%.
Pro Tip: Cross-reference churn with other metrics. If CSAT drops before churn spikes, you know poor service is driving customers away.
10. Ticket Backlog
Ticket Backlog counts how many unresolved tickets have exceeded your expected response or resolution time.
Think of backlog as overdue items. If your Service Level Agreement (SLA) promises 24-hour resolution and a ticket sits open for 3 days, it’s in your backlog.
A growing backlog signals that your team is overwhelmed or your processes are inefficient. Left unchecked, it leads to longer wait times, missed SLAs, and angry customers.
How to Track It:
Define your expected timeframes (based on SLAs). Then count tickets that exceed those limits.
Example: Your SLA promises 48-hour resolution. You have 75 tickets older than 48 hours. Your backlog is 75.
What to Watch For:
Occasional spikes are normal. Product launches or seasonal rushes cause temporary backlogs.
But a steadily growing backlog means you need more staff, better tools, or improved processes. Don’t ignore this warning sign.
Pro Tip: Break your backlog down by agent, channel, or issue type. You might discover one person is overwhelmed, or one problem type consistently takes too long.
11. Response Rate
Response Rate tracks what percentage of customers who contact you actually receive a response.
This might seem obvious (shouldn’t you respond to everyone?), but messages slip through the cracks. Social media mentions go unnoticed. Emails land in spam. Tickets get misrouted.
A response rate below 100% means you’re ignoring customers. And 56% of customers won’t even complain after a bad experience—they just quietly leave.
How to Calculate Response Rate:
Response Rate = (Number of contacts responded to / Total contacts received) × 100
What to Aim For:
100%. You should respond to every customer who reaches out, even if it’s just to say “We received your message and will investigate.”
Pro Tip: Set up alerts for messages sitting unanswered for more than a few hours. Catch them before they turn into missed opportunities.
12. Customer Lifetime Value (CLV)
Customer Lifetime Value estimates the total revenue a customer will generate throughout their relationship with your business.
While not strictly a customer service metric, CLV shows the long-term impact of great support. Happy customers buy more, stay longer, and refer friends.
Companies with superior customer experience grow 5 times faster because they maximize CLV.
Basic CLV Formula:
CLV = (Average purchase value × Purchase frequency) × Average customer lifespan
Example: A customer spends $50 per purchase, buys from you 4 times per year, and stays for 3 years on average.
CLV = ($50 × 4) × 3 = $600
Why This Matters for Support:
When you know a customer’s CLV is $600, you’ll invest more in keeping them happy. It justifies the cost of your support team by showing the revenue they protect.
Pro Tip: Calculate CLV by customer segment. High-value customers might deserve white-glove support while lower-value segments use self-service.
Related Post: How to Perform Customer Loyalty Analysis
Track These Metrics Automatically with UserFeedback
Manually tracking 12 different metrics across spreadsheets is a nightmare. UserFeedback for WordPress automatically tracks your most important customer service performance metrics for you.
These customer service metrics include:
✓ Customer Satisfaction Score (CSAT)
✓ Net Promoter Score (NPS)
✓ Customer Effort Score (CES)
✓ Response rates
✓ Trend analysis over time
Get instant insights without manual work.
How to Choose the Right Metrics for Your Business
The truth is, you can’t track everything.
Too many metrics create analysis paralysis. You spend all your time in spreadsheets instead of helping customers.
I recommend starting with 5-7 core metrics that align with your biggest goals. Here’s how to choose:
If Your Goal Is Speed and Efficiency:
Focus on:
- First Response Time
- Average Resolution Time
- First Contact Resolution
- Ticket Volume
- Ticket Backlog
These metrics reveal operational bottlenecks and show where your team needs help.
If Your Goal Is Customer Satisfaction:
Focus on:
- Customer Satisfaction Score (CSAT)
- Net Promoter Score (NPS)
- Customer Effort Score (CES)
- First Contact Resolution
- Response Rate
These metrics show how customers feel about your service and predict loyalty.
If Your Goal Is Business Growth:
Focus on:
- Customer Retention Rate
- Customer Churn Rate
- Customer Lifetime Value (CLV)
- Net Promoter Score (NPS)
- Ticket Volume (as a product quality indicator)
These metrics tie customer service directly to revenue and growth.
My Recommendation for Small Teams:
Start with these 5:
- Customer Satisfaction Score (CSAT)
- First Response Time
- First Contact Resolution
- Ticket Volume
- Customer Retention Rate
This mix gives you operational data, satisfaction scores, and business impact. You can always add more metrics later.
This is exactly the setup UserFeedback was built for. Our plugin makes it easy to track these 5 core metrics without switching between multiple tools or building complex spreadsheets.
Get started with UserFeedback →
Frequently Asked Questions: Customer Service Metrics
What are customer service metrics?
Customer service metrics are measurements that track how well your support team performs. They include satisfaction scores, response times, resolution rates, and other data points that reveal the quality and efficiency of your customer service.
Why are customer service metrics important?
Customer service metrics show you what’s working and what’s broken before you lose customers. They help you spot problems early, prove your team’s value to leadership, and make smart decisions about where to improve.
What are the most important customer service metrics to track?
The most important metrics are Customer Satisfaction Score (CSAT), Net Promoter Score (NPS), First Response Time, First Contact Resolution (FCR), and Customer Retention Rate. These five give you a balanced view of satisfaction, efficiency, and business impact.
How do you measure CSAT?
CSAT is measured through short surveys asking “How satisfied were you with your recent experience?” Customers rate satisfaction on a 1-5 or 1-10 scale. Calculate CSAT by dividing satisfied responses (4-5 on a 5-point scale) by total responses, then multiply by 100 to get a percentage.
How do you calculate NPS?
NPS asks “How likely are you to recommend us to a friend?” on a 0-10 scale. Responses of 9-10 are Promoters, 7-8 are Passives, and 0-6 are Detractors. Calculate NPS by subtracting the percentage of Detractors from the percentage of Promoters. For example, 60% Promoters minus 20% Detractors equals an NPS of 40.
What is a good CSAT score?
CSAT scores between 76-78% are average. Scores above 80% are good. Top-performing companies achieve 85% or higher. Any score above 80% indicates strong customer satisfaction with your service.
What is a good NPS score?
The average NPS score is 41 in retail. Scores above 50 are excellent. Anything above 70 is considered world-class. NPS varies by industry, so compare your score to your specific sector’s benchmarks.
What is First Contact Resolution (FCR)?
First Contact Resolution (FCR) measures the percentage of customer issues resolved during the first interaction, without requiring follow-ups.
Which customer service metrics should small businesses track?
Small businesses should track 5 core metrics: Customer Satisfaction Score (CSAT), First Response Time, First Contact Resolution, Ticket Volume, and Customer Retention Rate. This balanced mix covers satisfaction, efficiency, and business impact without overwhelming small teams with too much data.
That wraps it up!
I hope you found this guide to customer service metrics helpful. Understanding these numbers helps you build a support team that keeps customers happy and drives real business growth.
If you liked this article, I’d recommend checking out:
- Best Net Promoter Score Software Tools to Measure Customer Loyalty
- Bad Survey Questions: Types to Avoid (+ How to Fix Them)
- Ultimate Guide to Website Feedback
Haven’t tried UserFeedback yet? Get started now!
And don’t forget to follow us on X and Facebook to learn more about collecting customer feedback online.