
The Likert scale is the survey format I reach for most. It asks how much someone agrees, or how satisfied they are, across a fixed set of options.
Getting one right is mostly a matter of wording and how many options you offer. Both are easy to get wrong, and both get easier once you have seen enough examples side by side.
The wording problem is usually vagueness: a question asking two things at once, or a middle option meaning different things to different readers. The options problem is subtler, because four, five and seven points each change what people are willing to tell you.
Below are seven types of Likert scale, four scale lengths, and more than thirty questions you can copy. A comparison table sets the seven against each other, and a worked example at the end runs one question through to the numbers.
Table of Contents
- What Is a Likert Scale?
- 7 Types of Likert Scales with Examples
- Different Scale Lengths (With Examples)
- Real-Life Likert Scale Examples & Questions You Can Use
- Tips for Creating Great Likert Scale Questions
- Making Sense of Your Likert Scale Results
- The Good and Bad of Likert Scales
- Popular Likert Scales in the Real World
- FAQs About Likert Scales
What Is a Likert Scale?
A Likert scale offers a range of options running from one extreme to another, instead of a flat yes or no.
They’re named after Rensis Likert, the psychologist who created this method back in 1932. What makes them so valuable is how they turn complex feelings into something you can measure and analyze.
The classic Likert scale uses five points to measure agreement:
- Strongly disagree
- Disagree
- Neither agree nor disagree
- Agree
- Strongly agree
But there’s so much flexibility here!
Likert scales can have 4, 5, 6, 7, or even 10 points. And they can measure all sorts of things beyond agreement, like satisfaction, how often something happens, importance, and quality.
7 Types of Likert Scales with Examples
Let’s look at the most common types of Likert scales with some examples you might use:
1. Agreement Scale
This is the classic “do you agree or disagree” scale.
Example:
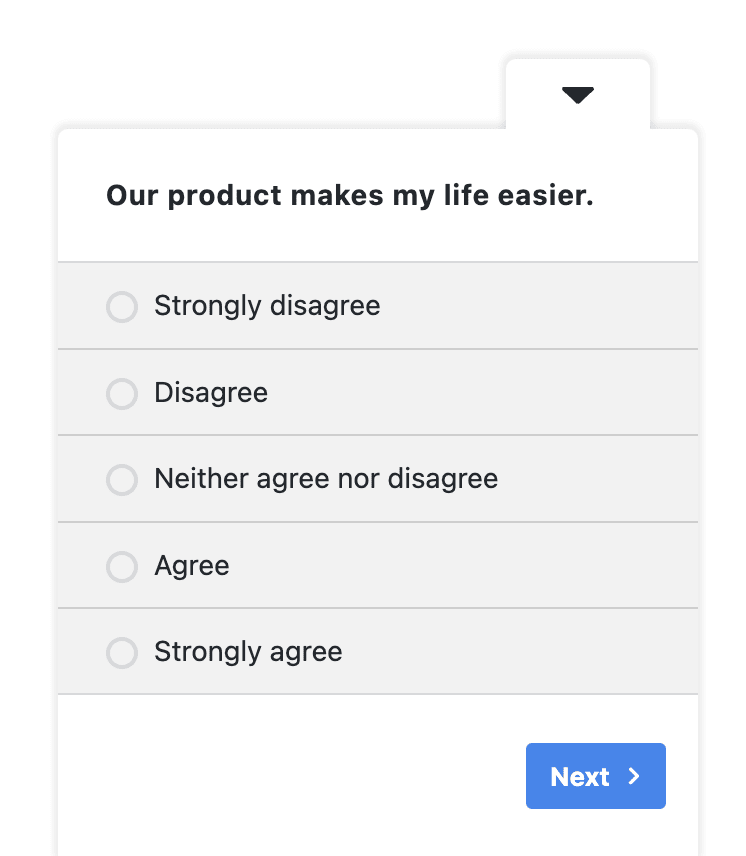
“Our product makes my life easier.”
- Strongly disagree
- Disagree
- Neither agree nor disagree
- Agree
- Strongly agree
This is easy to create using UserFeedback’s radio buttons:
2. Satisfaction Scale
How happy are your customers? This scale tells you!
Example:
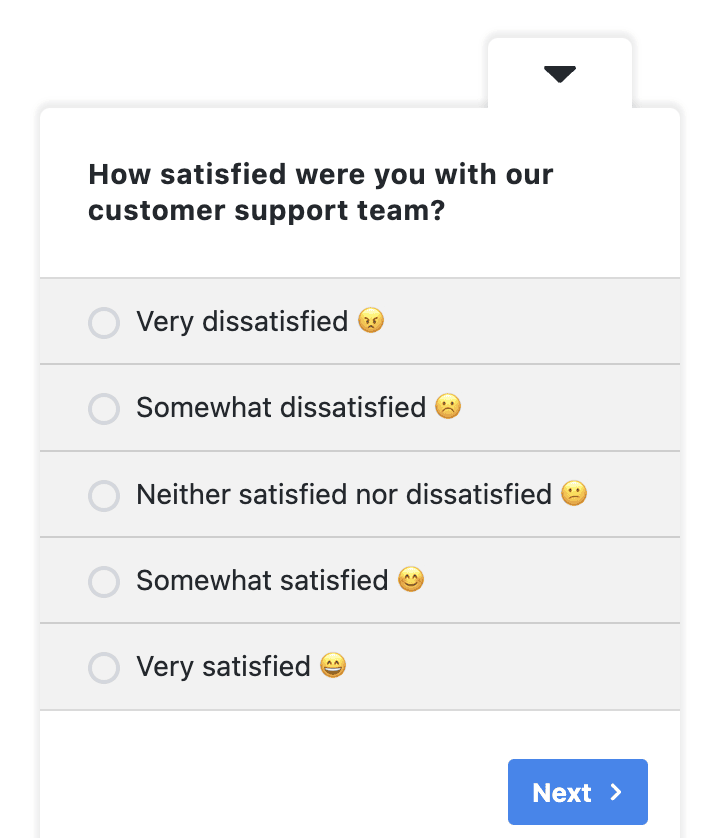
“How satisfied were you with our customer support team?”
- Very dissatisfied 😠
- Somewhat dissatisfied 🙁
- Neither satisfied nor dissatisfied 😐
- Somewhat satisfied 🙂
- Very satisfied 😊
You can easily add emojis to your UserFeedback surveys to make them more fun and interactive:
3. Frequency Scale
Find out how often something happens.
Example:
“How often do you use our mobile app?”
- Never
- Rarely
- Sometimes
- Often
- Always
4. Quality Scale
Get feedback on how good or bad something is.
Example:
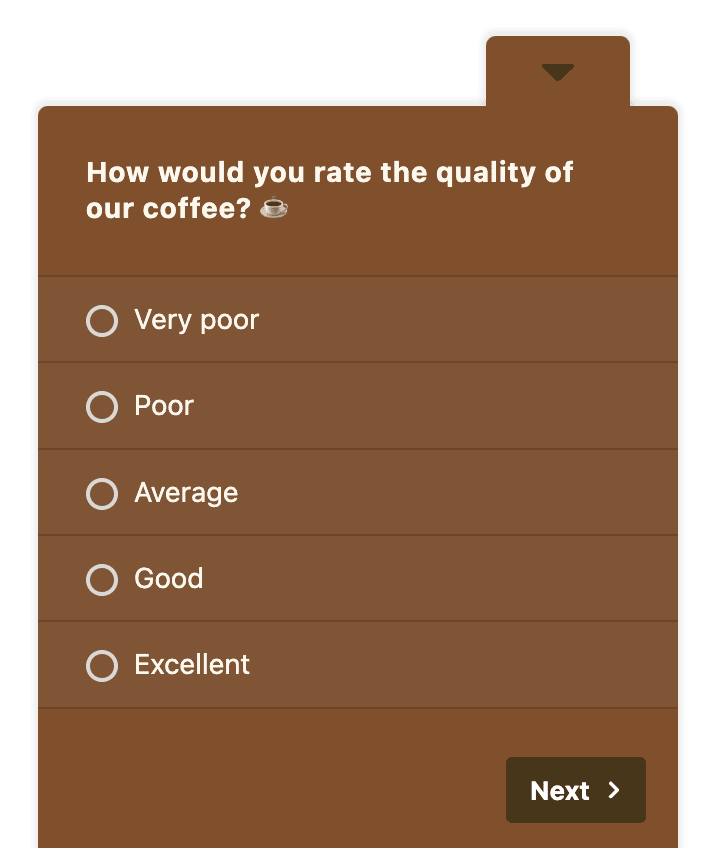
“How would you rate the quality of our coffee?”
- Very poor
- Poor
- Average
- Good
- Excellent
With UserFeedback, you can even brand your surveys to match your style or theme:
5. Importance Scale
Discover what matters most to your audience.
Example:
“How important is fast shipping to you?”
- Not at all important
- Slightly important
- Moderately important
- Very important
- Extremely important
6. Likelihood Scale
Find out how likely someone is to do something.
Example:
“How likely are you to eat at our restaurant again?”
- Very unlikely
- Somewhat unlikely
- Neither likely nor unlikely
- Somewhat likely
- Very likely
7. Effectiveness Scale
See how well something works for people.
Example:
“How effective was our training video in helping you set up your new device?”
- Not effective at all
- Slightly effective
- Moderately effective
- Very effective
- Extremely effective
Which Likert Scale to Use, Side by Side
The seven scales above answer different questions. This is the short version if you are deciding between them:
| Scale | What it measures | Anchors | Reach for it when |
|---|---|---|---|
| Agreement | Whether someone holds a view | Strongly disagree to strongly agree | You are testing a statement, not an experience |
| Satisfaction | How happy someone was | Very dissatisfied to very satisfied | You are asking about one specific interaction |
| Frequency | How often something happens | Never to always | You need behavior, not opinion |
| Quality | How good something is | Very poor to excellent | You are rating an output, like a product or a call |
| Importance | What someone values | Not at all important to extremely important | You are prioritizing a roadmap or feature list |
| Likelihood | What someone will probably do next | Very unlikely to very likely | You want intent, such as returning or recommending |
| Effectiveness | Whether something worked | Not effective at all to extremely effective | You are checking whether help actually helped |
When two rows both fit, use the simpler one; the difference will not show up in your answers.
Which of the seven you pick matters less than picking one and staying with it. A survey that switches scale type between questions gives you answers that do not line up.
Different Scale Lengths (With Examples)
You can customize your Likert scales to have different numbers of options. Here’s what those look like:
4-Point Scale
This scale removes the middle option, gently pushing people to pick a side.
Example:
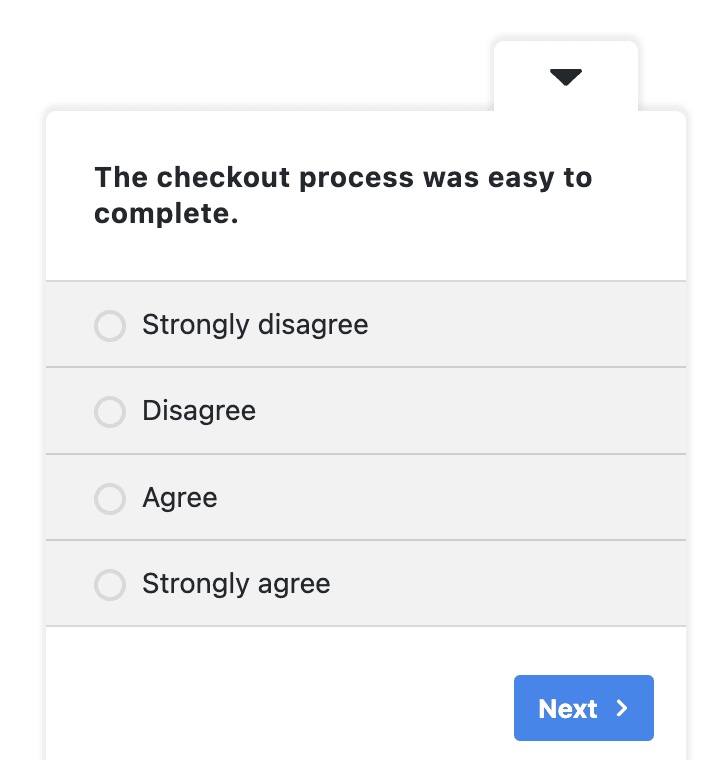
“The checkout process was easy to complete.”
- Strongly disagree
- Disagree
- Agree
- Strongly agree
Here, I just added 4 radio buttons instead of 5 to create the 4-point scale:
5-Point Scale
The classic scale with a neutral middle option.
Example:
“The customer service rep was friendly and helpful.”
- Strongly disagree
- Disagree
- Neither agree nor disagree
- Agree
- Strongly agree
7-Point Scale
This gives people more room to express the strength of their feelings.
Example:
“I love the new features in your app.”
- Strongly disagree
- Disagree
- Somewhat disagree
- Neither agree nor disagree
- Somewhat agree
- Agree
- Strongly agree
10-Point Scale
This offers maximum detail, like rating something from 1-10.
Example:
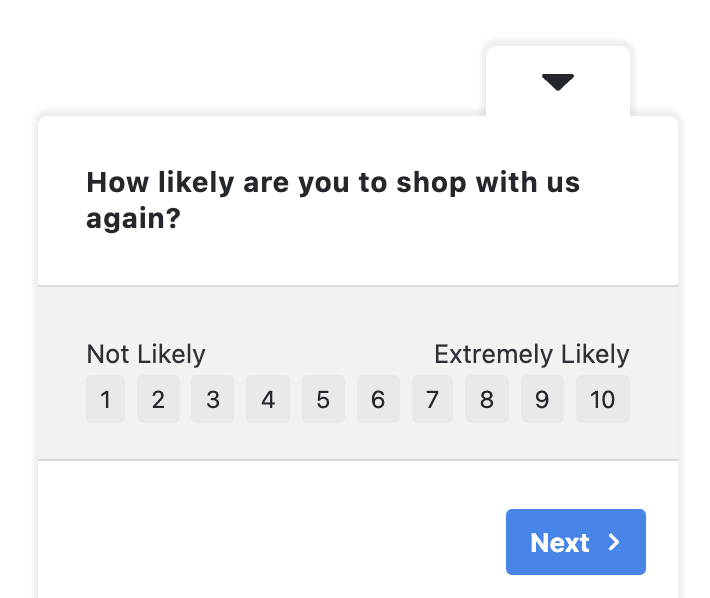
“How likely are you to shop with us again?”
- 1 = Not at all likely
- 2
- 3
- 4
- 5
- 6
- 7
- 8
- 9
- 10 = Extremely likely
UserFeedback provides this type of scale with its NPS survey question type:
Pick the length before you write the questions. Changing it later means rewriting every question that depended on having a middle option.
Real-Life Likert Scale Examples & Questions You Can Use
Here are some ready-to-use examples of Likert scale questions and surveys for different situations:
Customer Satisfaction Survey
Here are some great questions for customer satisfaction surveys:
- “How happy are you with your recent purchase?”
- “How would you rate your overall experience with our company?”
- “How easy was it to find what you needed on our website?”
- “How well did our product meet your expectations?”
- “How would you rate the value for money of our product?”
Check out 20 Customer Satisfaction Survey Examples & Templates to Use.
Employee Happiness Survey
Try these questions for employee feedback:
- “I feel valued at work.”
- “My manager gives me helpful feedback.”
- “I have what I need to do my job well.”
- “I see opportunity to grow my career here.”
- “I would tell a friend this is a great place to work.”
Employee surveys rest on whether people believe the answers are anonymous, and nothing in the responses will tell you which way they took it.
Product Feedback Survey
Try these questions:
- “The product was easy to figure out.”
- “The product helped me solve my problem.”
- “I found all the features I was looking for.”
- “The product worked reliably.”
- “I’ll likely keep using this product.”
Are you specifically looking to create a product feedback survey? Then I recommend you read How to Make a Powerful Product Feedback Survey.
Website Usability Survey
Try these questions:
- “The website was easy to navigate.”
- “I could quickly find what I was looking for.”
- “The website loaded fast enough.”
- “The checkout process was simple.”
- “I would visit this website again.”
Check this list of 65+ Website Usability Survey Questions (For Great Feedback).
Want to run one of these this week?
Every set above is built from radio buttons, star ratings and open text. UserFeedback puts them on your WordPress site without a developer.
Tips for Creating Great Likert Scale Questions
Want to get the best data from your Likert scale questions? Here are my top tips:
1. Keep It Simple and Specific
Be crystal clear about what you’re asking. Fuzzy questions give you fuzzy data!
- Instead of: “How was our service?”
- Try: “How satisfied were you with how quickly our support team responded?”
The test is whether two people would read the question the same way. If you are not sure, it is still too vague.
2. Ask About One Thing at a Time
Don’t cram multiple questions into one.
- Instead of: “Our product is high-quality and easy to use.”
Try splitting it:
- “Our product is high-quality.”
- “Our product is easy to use.”
If a question contains “and”, split it into two. Two short questions are easier to answer than one that covers two things.
3. Mix It Up
Include both positive and negative questions to keep people thinking.
- Positive: “The instructions were easy to follow.”
- Negative: “I found the instructions confusing.”
Reversing a question also tells you who is reading and who is clicking down the same column.
4. Stay Consistent
Use the same scale throughout your survey so people don’t get confused. So, if 1 was the lower or negative option, use that format in all your scales.
5. Pick the Right Number of Options
Choose your scale length based on what you need:
- 4 points: When you want people to take a side
- 5 points: When you want to allow for neutral feelings
- 7 points: When you want more detailed responses
- 10 points: When you want maximum detail
Longer scales give you more precision than most decisions need. If you would act the same way on a 4 and a 5, use four points.
None of these five are hard, which is why they get skipped when you are writing quickly, and why each one shows up later as answers you did not get.
Making Sense of Your Likert Scale Results
Once you’ve collected your responses, here’s how to understand what you’ve got:
1. Basic Number Crunching
For single questions:
- What was the most common answer?
- What was the middle answer?
- Create charts to visualize your results
For multiple related questions:
- Calculate the average (if appropriate)
- Look at how spread out the answers are
Start by counting how many people picked each option, because every number that follows is a summary of that spread.
2. Turning Responses Into Numbers
To analyze responses, assign numbers:
- Strongly disagree = 1
- Disagree = 2
- Neither agree nor disagree = 3
- Agree = 4
- Strongly agree = 5
Averaging assumes every step on the scale is the same size, and the gap between neutral and agree is rarely the gap between agree and strongly agree.
3. Understanding What It All Means
- Look for patterns in your data
- Compare different groups
- Identify your strengths and areas for improvement
- Pay attention to any surprising responses
Read my full guide on Customer Feedback Analysis.
A Worked Example, Start to Finish
Numbers help more than descriptions here, so here is one question all the way through. Say 100 people answer “The checkout process was easy to complete” on a five-point agreement scale.
The replies come in at 8 strongly disagree, 17 disagree, 20 neither, 39 agree and 16 strongly agree.
The mode is the most common answer, which is agree at 39 replies. The median is the middle reply once you line all 100 up, which also lands on agree. Scoring the options 1 to 5 gives a mean of 3.38.
Mode and median both say agree, which makes the result look comfortable. The mean sits at 3.38, closer to neutral than to agree, and that gap is the useful part. It comes mostly from the quarter who found checkout difficult, and mode and median on their own would have left them invisible.
Key Takeaway
Mode and median tell you which answer came up most often; the mean is what registers the people who disagreed. Read them together or you will miss the quarter of your respondents who did.
The Good and Bad of Likert Scales
Likert scales are great tools for understanding your customers, but like all things, they have pros and cons.
The Good:
- Super easy to understand for everyone involved
- Gives you numbers you can analyze
- Captures shades of meaning beyond yes/no
- Flexible enough to measure all sorts of opinions
- Makes it easy to compare across different questions
The Tricky Parts:
- People sometimes avoid picking extreme options
- Some folks default to middle options
- People tend to agree more than disagree
- Different people interpret the scale differently
- Doesn’t give you the deep “why” behind responses
This is why it’s a good idea to combine rating scales with qualitative data or open-ended questions. To learn more, read What Is Qualitative Feedback? (Plus Examples).
Popular Likert Scales in the Real World
Likert scales are commonly used in these cases:
Net Promoter Score (NPS)
This super popular scale asks just one question:
“How likely are you to recommend our company/product/service to a friend or colleague?”
People answer from 1 to 10, and get grouped as:
- Detractors (1-6): Unhappy customers
- Passives (7-8): Satisfied but unenthusiastic customers
- Promoters (9-10): Enthusiastic customers who will refer others
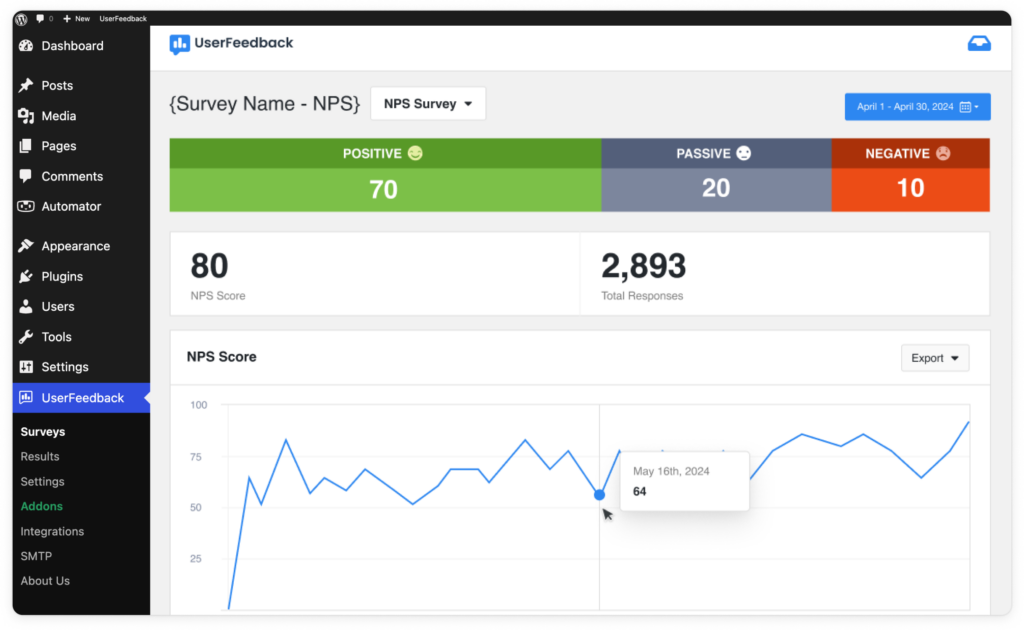
To get your NPS score, subtract the percentage of Detractors from the percentage of Promoters.
Or use UserFeedback if you’re on WordPress. UserFeedback’s NPS report feature gives you real-time insights right in your WordPress dashboard. No more spreadsheets or manual calculations!
Customer Satisfaction Score (CSAT)
This measures happiness with a specific interaction:
“How satisfied were you with your recent experience?”
- Very dissatisfied
- Somewhat dissatisfied
- Neither satisfied nor dissatisfied
- Somewhat satisfied
- Very satisfied
Check out this example I created with UserFeedback using the star rating question type:
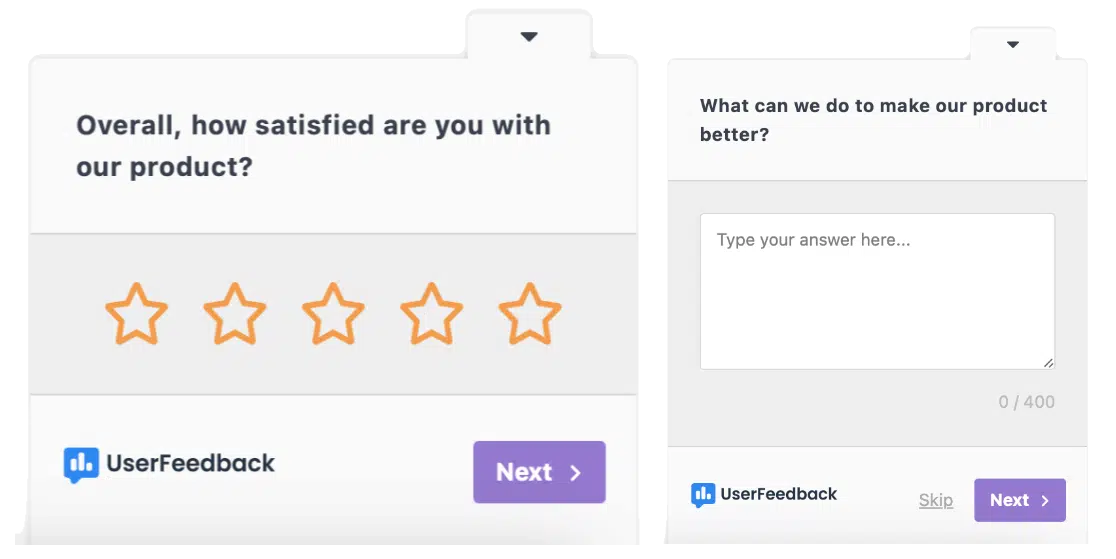
CSAT works best on one specific interaction. Ask it about the whole experience and you will not be able to tell which part moved the score.
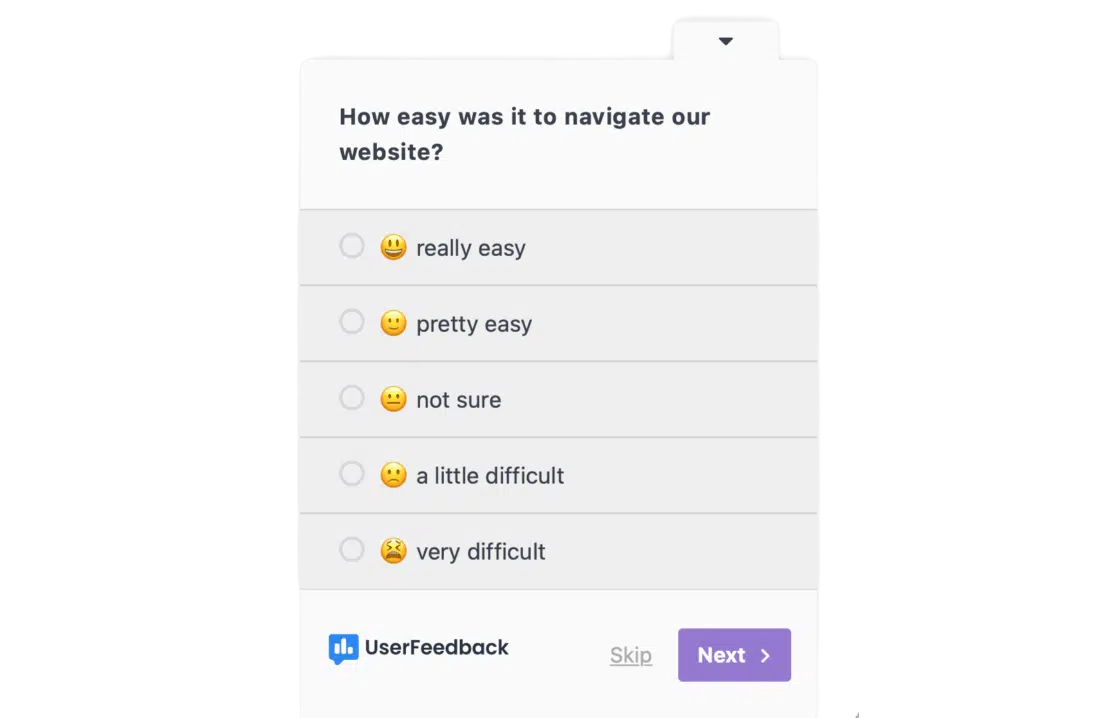
Customer Effort Score (CES)
This tells you how easy it was for customers to get help:
“How easy was it to get what you needed today?”
- Very difficult
- Difficult
- Neither easy nor difficult
- Easy
- Very easy
I like to combine CES surveys with emojis:
Check out this tutorial: How to Get and Improve Your Customer Effort Score (WordPress)
FAQs About Likert Scales
What’s the difference between a Likert scale and a Likert-type scale?
A true Likert scale combines multiple related questions that measure the same thing. A Likert-type question is a single question using the Likert format.
Is a Likert scale qualitative or quantitative?
It’s a bit of both! Likert scales collect qualitative opinions but express them in a quantitative way that you can analyze with numbers.
Should I use an odd or even number of options?
Odd numbers (5, 7) include a middle “neutral” option. Even numbers (4, 6) make people lean one way or the other. Choose based on whether you want to allow neutral responses.
How many options should I include?
Most research shows that 5 to 7 options work best. Fewer than 5 might not capture enough detail, while more than 7 can overwhelm people without adding much value.
How can I reduce bias in my surveys?
Mix up positive and negative questions, randomize the order, use clear language, and make sure responses are anonymous to get the most honest feedback.
That’s it! I hope this article helped you pick the right Likert scale and write questions that give you usable answers.
I’d recommend you also check out:
- AI Feedback Analysis 101: A Complete Guide
- How to Make a Good Survey: 13 Practical Tips
- 12 Proven Ways to Increase Your Survey Response Rate
- The Ultimate Guide to Customer Feedback
- Bad Survey Questions: 8 Types to Avoid
- Qualitative vs Quantitative Research
And don’t forget to follow us on X and Facebook for more about creating surveys and collecting user feedback online.